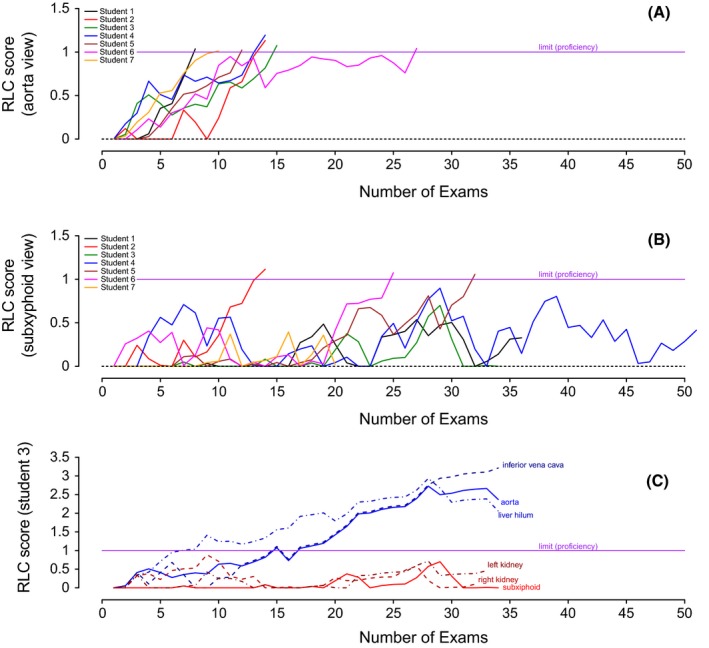
Figure 1.

Learning curves with RLC of (A) all students for aorta view; (B) all students for subxyphoid view; and (C) student 3 for aorta, inferior vena cava, liver hilum, kidneys, and subxyphoid views. RLC = risk‐adjusted learning curve cumulative summation.
