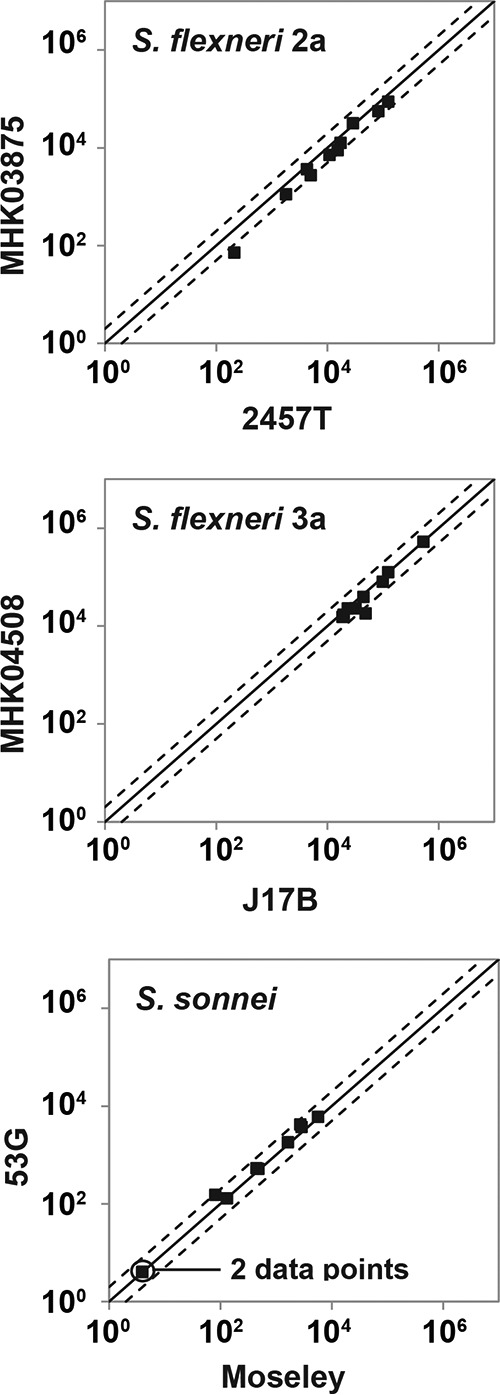
FIG 3 .

Comparison of killing indices obtained with different SBA target strains. The SBA was performed with two different target strains indicated in x and y axes using 10 serum samples from healthy adults. The line of identity (solid line) and a 2-fold deviation from the line of identity (dotted lines) is shown. Pearson’s R2 is 0.98 for S. flexneri 2a, 0.93 for S. flexneri 3a, and 0.99 for S. sonnei.
