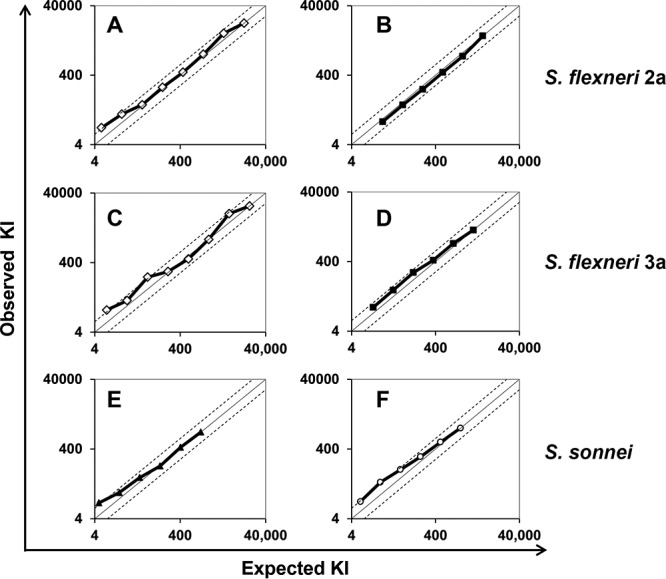
FIG 5 .

Observed KIs (y axis) were compared to expected KIs (x axis) for each sample. Expected KI was calculated by dividing the KI of the undiluted sample by the predilution factors. Two different adult serum samples were used for S. flexneri 2a (A and B), S. flexneri 3a (C and D), and S. sonnei (E and F). The line of identity (solid line) is shown along with two dotted lines showing 2-fold deviations from the identity.
