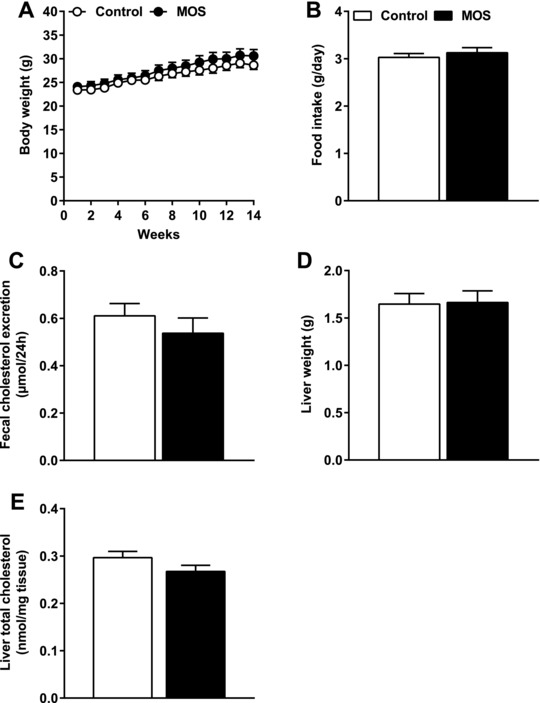
Figure 4.

The cholesterol‐lowering effect of MOS was not due to differences in cholesterol intake, fecal cholesterol excretion, or liver cholesterol levels. A) Body weight, B) food intake, C) fecal cholesterol excretion, D) liver weight, and E) liver TC were determined in mice fed a WTD with or without MOS for 14 weeks. Open bars/circles represent the control group and closed bars/circles represent the MOS group. Values are presented as means ± SEM (n = 15 mice per group). p < 0.05 was considered as statistically significant.
