Figure 5.

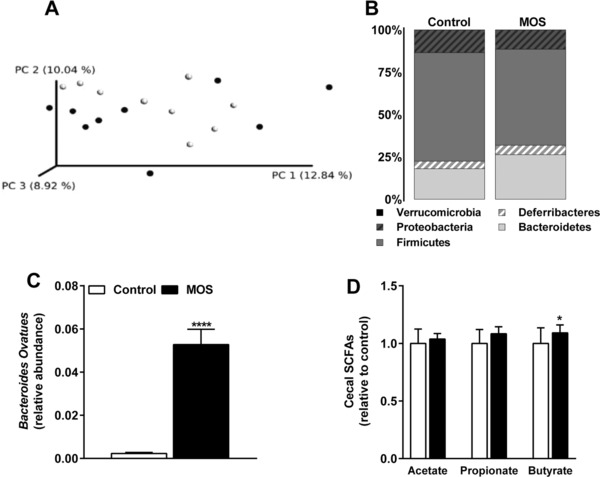
MOS increased the abundance of cecal Bacteroides ovatus and butyrate. A) Principal coordinates analysis plot of unweighted UniFrac distances of 16S rRNA gene sequences in which each circle represents an individual mouse. B) Microbiota composition at phylum level in cecal samples, C) relative abundance of B. ovatus, and D) the cecal SCFAs acetate, propionate, and butyrate of mice fed a WTD with or without MOS for 14 weeks. Open bars/circles represent the control group and closed bars/circles represent the MOS group. Values are presented as means ± SEM (n = 15 mice per group). *p < 0.05, **p < 0.01, ***p < 0.001, ****p < 0.0001 versus control.
