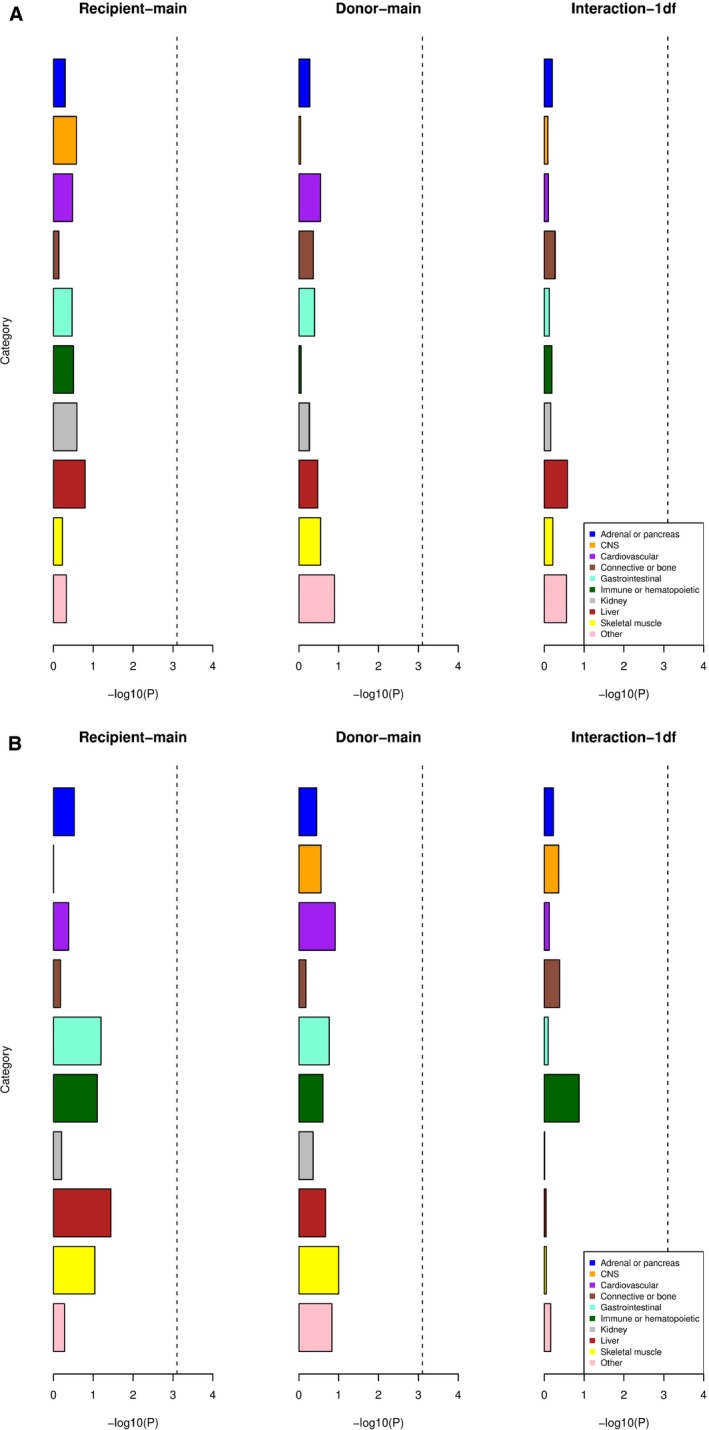
Figure 2.

Partitioned heritability analysis of graft survival GWAS results. X‐axis indicates –log10 (P value) for a test for heritability enrichment within 10 cell/tissue‐type categories of genomic annotations, marking tissue‐ or cell‐type‐specific activity. Dotted lines indicate Bonferroni significance level. (A) Death treated as a censored event; (B) death treated as a failure event. CNS, central nervous system
