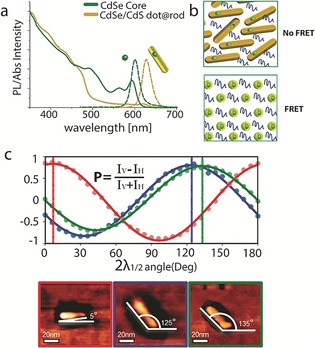
Figure 6.

a) Absorption and PL emission spectra of bare CdSe seed CQDs (4.3 nm in diamater, green) and the corresponding spectra of CdSe/CdS‐seeded rods with the same seeds (dimensions 4.7×30 nm, yellow), showing the separation between the absorption and emission upon rod growth. b) Illustration of close‐packed SCNCs layer. Whereas the spatial separation between the emitting cores is short for dot‐in‐sphere structures and leads to a FRET process, the emitting cores for dot‐in‐rod structures are separated and FRET is eliminated. Reprinted from Ref. 85 with permission). c) Emission polarization (P) of several dot‐in‐rod SCNCs correlated with their AFM image. The polarization direction is aligned with the long axis of the rod. Reprinted from ref. 86 with permission.
