
Figure 2.
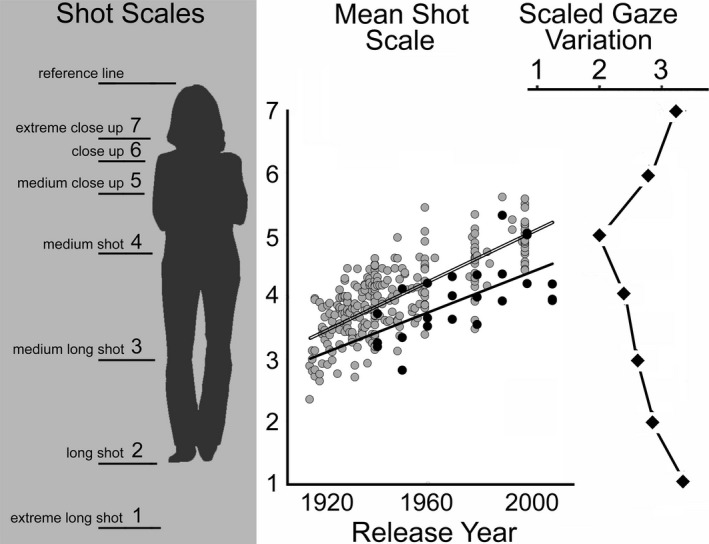
The left panel shows a mock‐up of how shot scales are determined and numbered (adapted from Cutting & Armstrong, 2016). The central panel shows the results of Study 1. The gray dots are the mean shot scales of 271 movies analyzed by Salt (1992, 2006, and http://www.cinemetrics.lv/satltdb.php#ss). The black dots are the mean shot scales for 24 movies analyzed by Cutting et al. (2012). The right panel shows, as diamonds, the data of Smith (2013; Mital et al. 2011) for the variability across viewers of their fixation position on personal screens as a function of shot scale. In this display, leftward shifts indicate more uniform gaze across viewers (less variation) and rightward shifts less uniformity (more variation). Because theater screens take up more of the visual field, the function for theater viewing would be shifted somewhat downward. Either way, notice that the convergence of the mean shot scale data for movies and uniformity of cross‐viewer gaze fixation as a function of shot scale. The data plots are an extensive elaboration and reconfiguration of Cutting (2015, Fig. 5).