
Figure 6.
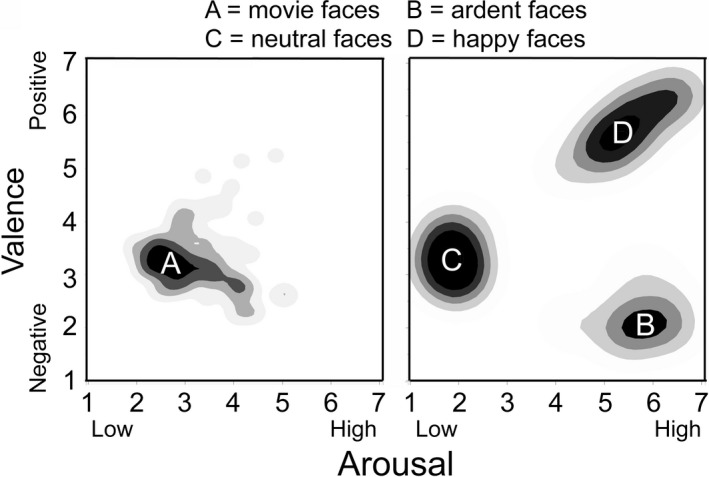
Results of Study 3. Rating data are plotted as density clouds in Cartesian coordinates of valence against arousal. The darkest regions represent the smoothed 20% thresholds of the data, followed by lighter areas of 40%, 60%, and barely visible 80%. The data represented in the left panel (movies faces, Group A) represent judgments of stills taken from the cryptic reaction shots (n = 72). The data in the right panel show the three sets of control stimuli; Group B represents the ardent faces (three each of anger, disgust, fear, sad, and surprised faces from Ekman & Friesen, 1975; n = 15); Group C represents the neutral faces (from Righi et al., 2012; http://wiki.cnbc.cmu.edu/Face_Place; n = 18); and Group D represents the happy faces (n = 21, 18 from a Google image search and 3 from Ekman & Friesen, 1975).