Figure 1.

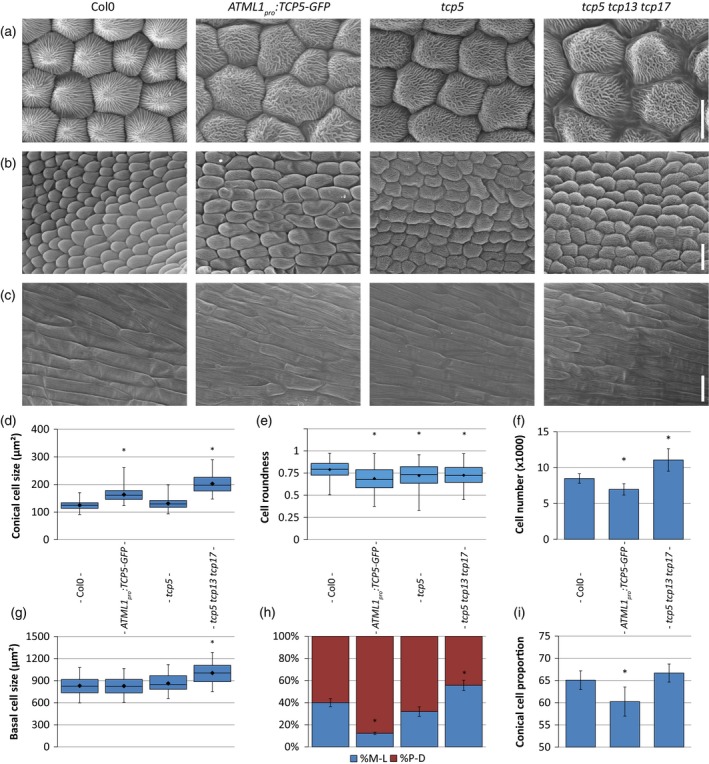
Overview of cellular phenotypes in petals of Col‐0, ATML1 pro :TCP5‐GFP, tcp5 and tcp5 tcp13 tcp17 mutant plants.
Scanning electron micrographs of the distal (a), central (b) and proximal (c) parts of the petal. Boxplots show the cell sizes of conical cells at the distal part of the petal in (d). (e) The roundness of the conical cells and (f) the total number of conical cells. (g) The size of basal cells. (h) The direction of cell elongation, medial–lateral (blue) or proximodistal (red). (i) The proportional area of conical cells in the petal. Scale bars: (a) 10 μm; (b), (c), 20 μm. Box plots (d, e and g) show mean (dot on horizontal line), median (middle horizontal line), second to third quartiles (box), and minimum and maximum ranges (vertical lines). The bars (f, h and i) indicate means and SDs. In both cases an asterisk indicates that the mean is significantly different from wild type (P < 0.05, Student's t‐test). At least 50 cells from 12 petals were analysed. [Colour figure can be viewed at http://wileyonlinelibrary.com]
