Figure 2.

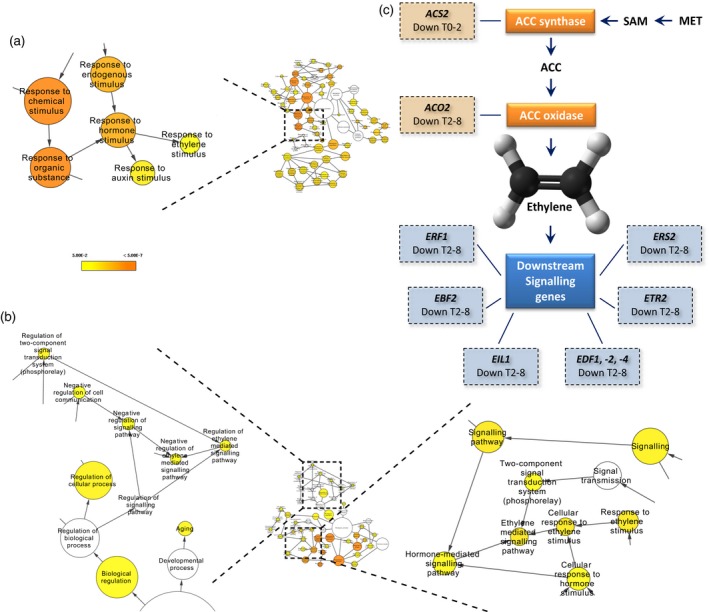
Over‐representation of ethylene signalling genes among the differentially expressed genes.
(a), (b) Hormone related Gene Ontology (GO) terms for (a) differentially expressed genes after 2 h induction (T0–2) and (b) differentially expressed genes after 8 h induction (T2–8). The colour bar in (a) and (b) indicates significance levels for the GO categories (FDR < 0.05), The circle size represents the number of genes present for a particular GO term. In the case of, for example, response to ethylene biosynthesis, the size corresponds to 12 and 17 genes, respectively.
(c) Differentially expressed genes in the ethylene biosynthesis and signalling pathway in either the first time point (T0–2) or the second (T2–8); lines indicate that, for example, ACS2 is a 1‐amino‐cyclopropane‐1‐carboxylate (ACC) synthase and link the different gene classes to individual genes in that class showing differential expression. SAM, S′‐adenosyl‐l‐methionine; MET, methionine.
