Figure 4.

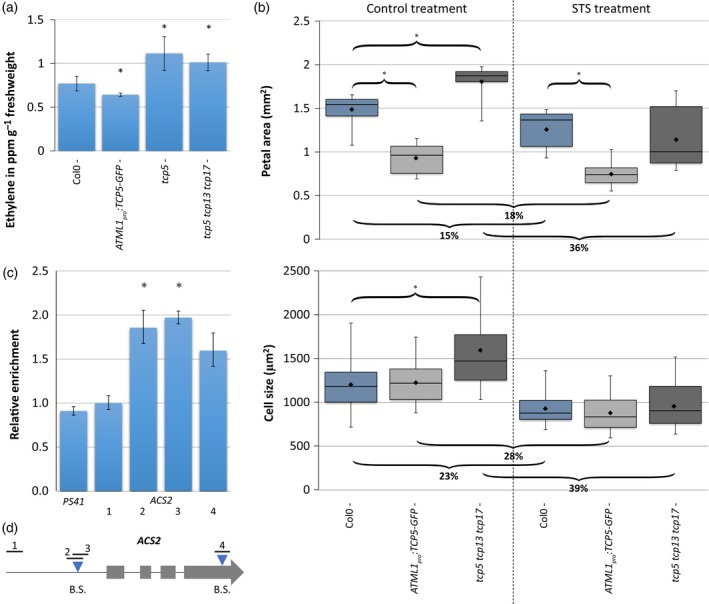
TCP5 inhibits ethylene biosynthesis.
(a), (b) Quantification of ethylene production of inflorescences (per hour per gram fresh weight) (a) and petal area and petal cell size analysis in control (left) and silver thiosulphate (STS) (right) treatment (b). Curly brackets with asterisks above indicate a significantly different area versus Col‐0 wild type. Curly brackets below show the percentage of decline in petal area and cell size in STS‐treated samples compared with the control treatment. Treatment with STS had a significant effect for all plants tested. Bars in (a) show the mean of at least five biological replicates. The boxplot in (b) shows mean (dot on horizontal line), median (middle horizontal line), second to third quartiles (box), minimum and maximum ranges (vertical lines). Twelve petals were analysed for petal area, and at least 50 cells from these petals were analysed for size. In both cases an asterisk indicates a significantly different mean from the wild type (P < 0.05, Student's t‐test).
(c) Binding of TCP5‐GFP to the ACS2 locus confirmed by chromatin immunoprecipitation (ChIP)‐qPCR. Binding of TCP5 is tested for regions 1–4, of which regions 2, 3 and 4 cover a putative binding site, indicated in (D). PS41 is the negative control. The data were normalized against ACT2. Means ± SEM of three biological replicates are shown. The asterisks above the columns indicate a significant difference between TCP5:GFP and input (P < 0.05, t‐test).
(d) Schematic diagram of the ACS2 locus. Grey boxes indicate the exons, blue triangles indicate the positions of putative TCP‐binding motifs (B.S.) and black lines show the amplified fragments in ChIP‐qPCR. [Colour figure can be viewed at http://wileyonlinelibrary.com]
