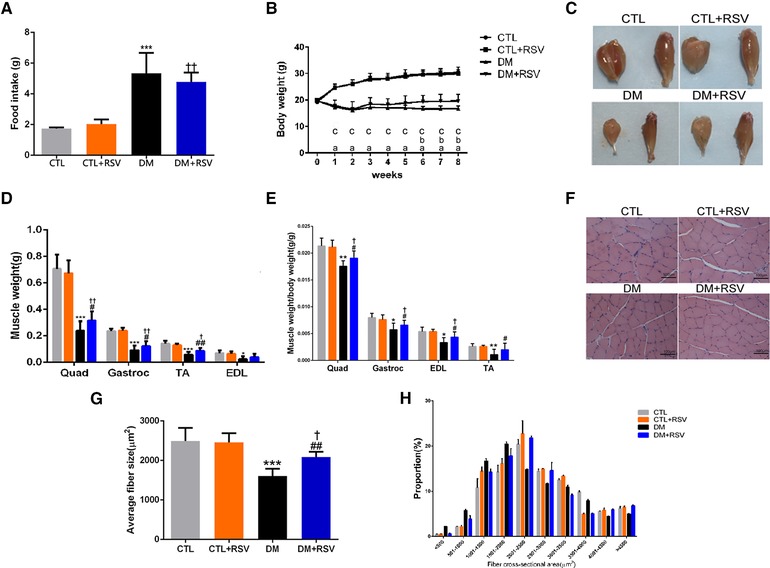
Figure 1.

Feeding the diabetes mellitus (DM) mice with the RSV‐enriched diet preserved muscle atrophy in the model of DM induced by streptozotocin. A) Food intake. B) Body weight. C) Macroscopic view of the gastrocnemius (Gastroc) and tibialis anterior (TA) muscles. D) Weight of the quadriceps (Quad), Gastroc, TA, and extensor digitorum longus (EDL) muscles were normalized to tibia length. E) Changes in Quad, Gastroc, TA, and EDL normalized to body weight. F) Hematoxylin and Eosin (HE) staining of the TA muscle. Scale bar: 100 μm. G) Average fiber size of the HE‐stained TA muscle. H) Muscle fiber frequency distribution of the HE‐stained TA muscle. Results are presented as mean ± SD, n = 4–10 per group. a, p < 0.001 between control (CTL) and DM groups; b, p < 0.05 between DM and DM+RSV groups; c, p < 0.05 between CTL+RSV and DM+RSV groups. *p < 0.05; ***p < 0.001 between CTL and DM groups. #p < 0.05; ##p < 0.01 between DM and DM+RSV groups. † p < 0.05; †† p < 0.01 between CTL+RSV and DM+RSV groups.
