
Figure 5.
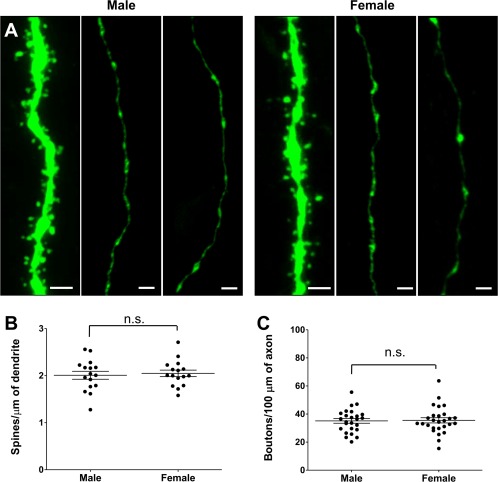
No sex difference in synaptic spine and bouton density at P40. (A) Representative images of GFP+ CA1 dendrites and CA3‐CA1 axons in Thy1::GFP males and females at P40. (B) Spine density measurements revealed no difference between males and females (n = 16 neurons from three animals for both sexes (C) Bouton density measurements revealed no difference between males and females (n = 25 and 27 axons from three animals for both sexes). The data are presented as mean ± SEM. Scale bar = 2 µm. [Color figure can be viewed at http://wileyonlinelibrary.com]