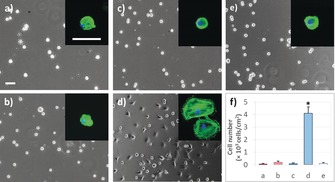
Figure 3.

Representative micrographs of mouse 3T3 cells after culture for 3 h on a) NIB, b) NIB with RGD‐based peptide, c) EIB, d) EIB with RGD‐based peptide, and e) EIB with non‐adhesive RGE‐based peptide. RGE=Arg‐Gly‐Glu. The RGD‐ or RGE‐bound surfaces were obtained by incubation in peptide solutions (51.8 nm in PBS) for 12 h. Insets are the representative fluorescence micrographs of attached cells on differrent surfaces. Scale bar: 50 μm. f) Cell‐adhesion efficiency on different surfaces. Statistically significant differences are indicated by * p<0.001 as compared with others.
