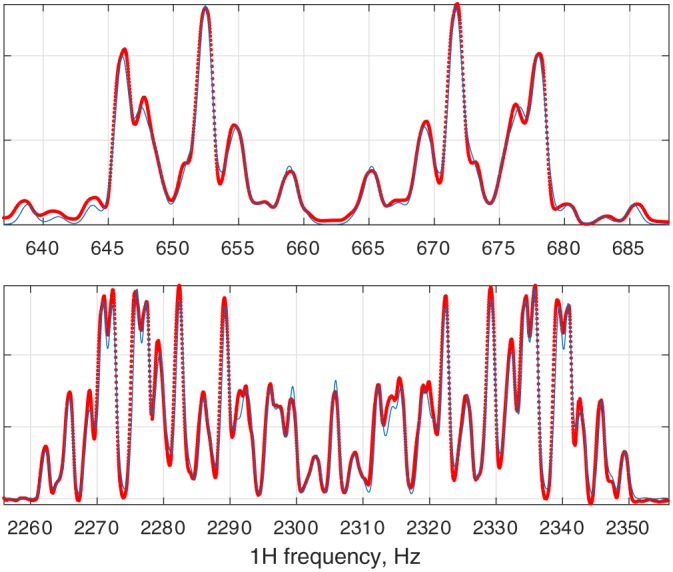
Figure 6.

The result of the fitting of a 500 MHz 1H NMR spectrum of anti‐2,3‐difluoro‐n‐butane with respect to chemical shifts, J‐couplings, and line width. Red dots: experimental data. Blue lines: fitted spectrum. This calculation is included into the standard example set supplied with Spinach
