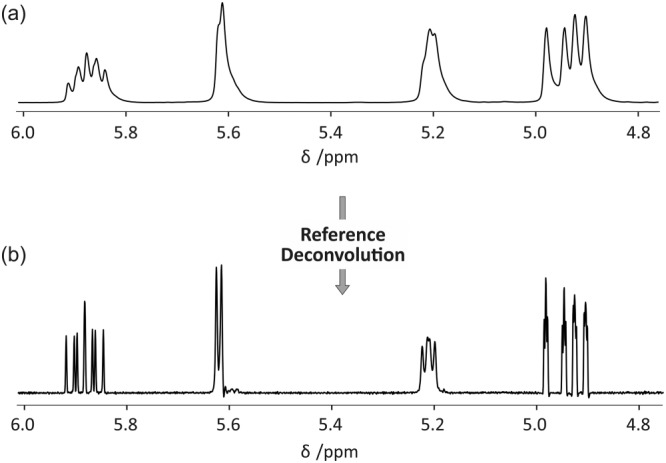
Figure 5.

Schematic illustration of simple reference deconvolution processing using data acquired with non‐optimal shimming. Deconvoluting the raw experimental spectrum (a) with the methoxy lineshape contained between the red and green lines in Figure 4 and reconvoluting with a 1 Hz Gaussian wide lineshape give the corrected spectrum (b) with clean lineshapes
