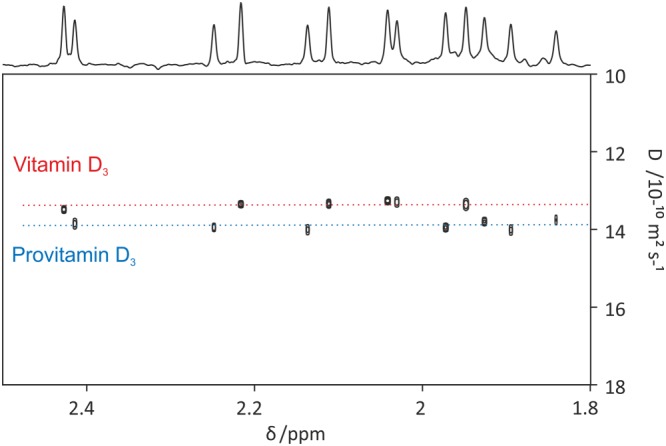
Figure 11.

PSYCHE‐iDOSY spectrum of a mixture containing 50 mM each of vitamin D3 and provitamin D in acetone‐d 6. Data for the original publication79 were processed with the GNAT software. Prior to DOSY analysis, 1D data were processed by pure shift reconstruction, zero‐filling, apodisation (with 1 Hz additional Gaussian linewidth), Fourier transformation, and phase and baseline correction. The DOSY plot was constructed using peak picking with a user‐defined threshold and a monoexponential fit
