
Figure 1.
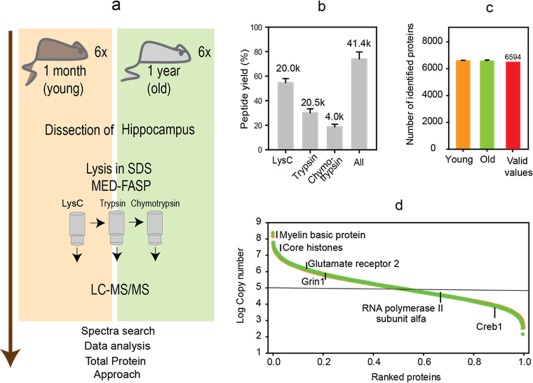
Proteomic analysis of hippocampi from young and middle‐aged mice. (a) Proteomic workflow. Hippocampi were isolated from 6 animals per group. The tissue lysates were processed by MED‐FASP procedure with three steps of enzymatic digestion. Peptides were analyzed by LC‐MS/MS. The spectra were searched using MaxQuant software. Proteins were quantified by means of Total Protein Approach. (b) Protein to peptide conversion and peptide analysis. The numbers above the columns show the average number of peptides identified from each digest (k, values are in thousands). (c) Number of proteins matching the peptides identified in the mass spectrometric analysis. 6,594 proteins were identified in at least 9 of 12 samples (valid values) and were used for the statistical analysis. (d) Distribution of protein copy numbers across the identified proteins [Color figure can be viewed at http://wileyonlinelibrary.com]