
Figure 2.
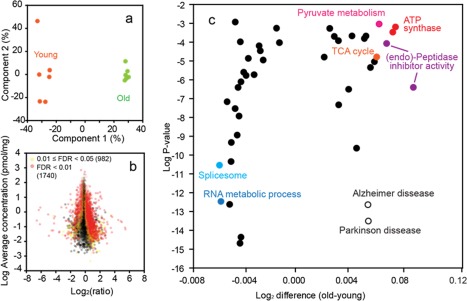
Statistical analysis of the proteomic data. (a) Principal component analysis of the protein concentration values of 6,594 protein (valid values). Missing values were imputed. (b) Heat map: Distribution of protein ratios versus protein concentrations. Proteins with significantly changed titers are shown in yellow (.01 ≤ FDR < .05) and red (FDR < .01). Numbers in the parentheses show the number of proteins in each group. (c) Identification of significantly changed protein groups matching gene ontology or KEGG terms (complete data set is in Supporting Information, Table S4) [Color figure can be viewed at http://wileyonlinelibrary.com]