
Figure 5.
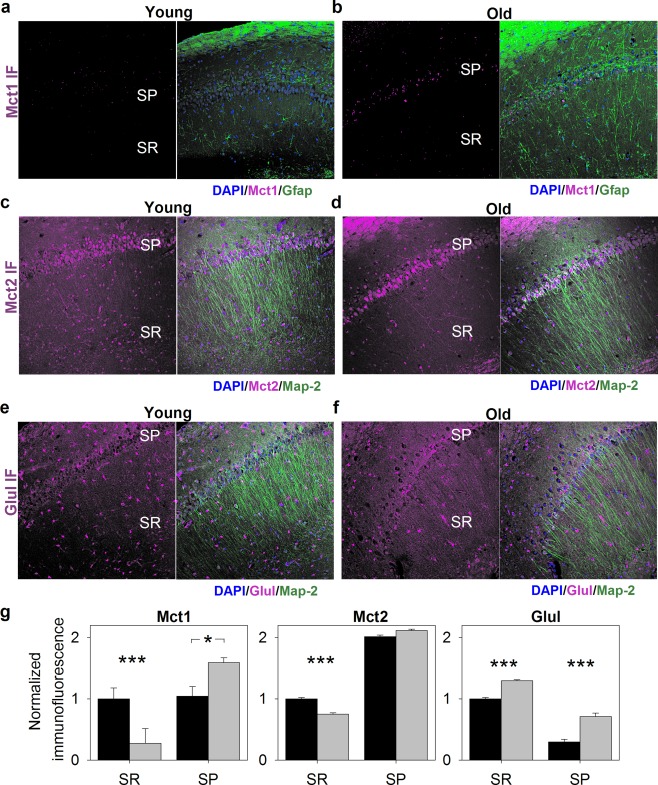
Cellular distribution of monocarboxylate transporters (Mct) and glutamine synthetase (Glul) in the hippocampus of young and middle‐aged (“Old”) animals. (a–f) Exemplary confocal images of immunofluorescence distribution for Mct1 (a–b, magenta), Mct2 (c and d, magenta) and Glul (e and f, magenta) acquired at low magnification (obj. 20×) from slices of young (left panels) and aged animals (right panels). Localization of neurons, astrocytes and cellular nuclei was revealed with antibodies against microtubule‐associated protein 2 (Map2, green), glial fibrillary acidic protein (GFAP) and DAPI (blue), respectively. Abbreviations: SP, stratum pyramidale; SR, stratum radiatum. (g) Quantification of immunofluorescence for Mct1 (left panel), Mct2 (middle panel), and Glul (right panel). All immunofluorescence was normalized to values obtained within stratum radiatum of young animals. Note, that aging promotes an increase in Glul immunofluorescence in both SP and SR hippocampal layers. In contrast, Mct1 and Mct2 were downregulated in the area on neuronal dendrites (SR) and Mct2 distribution was shifted towards neuronal somata (SP). Asterisks indicate a statistically significant difference (*p < .05, ***p < .001). IF, immunofluorescence [Color figure can be viewed at http://wileyonlinelibrary.com]