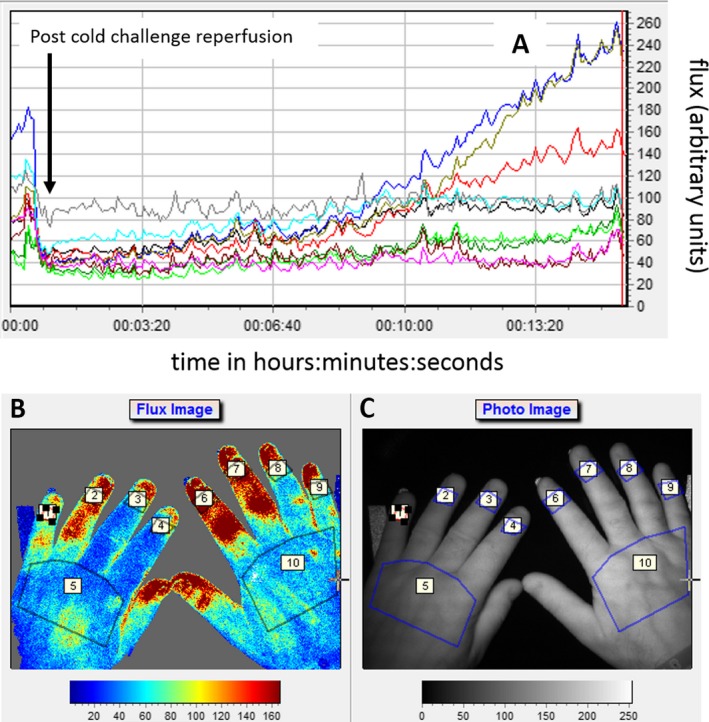
Figure 2.

A, Laser speckle contrast imaging (LSCI) reperfusion graphs for 8 digits (regions of interest [ROIs] 1–4 and 6–9, as shown in B) and 2 dorsa (ROIs 5 and 10). Graphs show reperfusion post–cold challenge (i.e., flux, which was proportional to the product of the average speed of the blood cells and their concentration, expressed in arbitrary perfusion units) versus time. B, Example of a flux image (i.e., perfusion map) showing ROIs marked (as described in Figure 1). C, Photograph of the hands showing the ROIs assessed by LSCI.
