Figure 1.

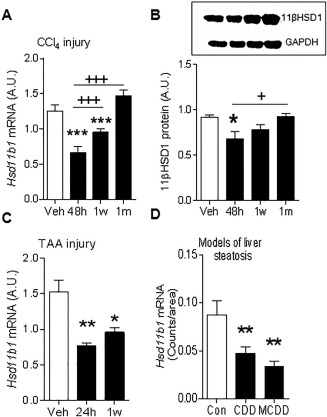
Reduced 11βHSD1 expression in mouse models of liver fibrosis. Hepatic 11βHSD1 mRNA levels measured by real‐time PCR (A) and protein levels (B), with upper panel showing representative immunoblot for 11βHSD1 and glyceraldehyde 3‐phosphate dehydrogenase and lower panel quantification graph, during peak (48 hours) and resolution (1 week, 1 month) phases in the reversible CCl4 (A,B) and TAA (C) liver fibrosis models, n = 6/group. (D) Hepatic Hsd11b1 mRNA levels in control diet, choline‐deficient diet, and MCDD NASH models, assessed by in situ mRNA hybridization (quantification graph showing average grain counts per area), n = 6/group. * P < 0.05, ** P < 0.01, *** P < 0.001 compared to the vehicle group (A‐C); + P < 0.05, +++ P < 0.001 compared to the 48‐hour injury time point. Abbreviations: A.U., arbitrary unit; GAPDH, glyceraldehyde 3‐phosphate dehydrogenase.
