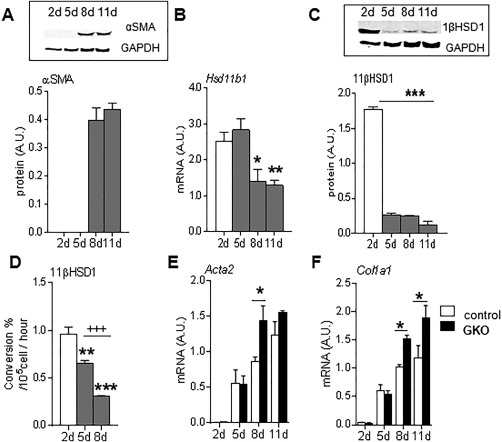
Figure 2.

Reduced 11βHSD1 expression during HSC activation in vitro. Expression levels of 11βHSD1 and αSMA during ex vivo wild‐type mouse HSC activation in vitro (n = 3/group). (A) αSMA protein, (B) Hsd11b1 mRNA, (C) 11βHSD1 protein, and (D) 11βHSD1 enzymatic activity (percent conversion of 11‐dehydrocorticosterone to corticosterone) were measured during 2‐11 days postactivation. Comparison of Acta2 (E) and Col1a1 (F) mRNA levels in wild‐type (white bars) and GKO (black bars) HSCs during 2‐11 days postactivation. * P < 0.05, ** P < 0.01, *** P < 0.001 compared to basal day 2 (A‐D) or between genotypes within a time point (E,F); +++ P < 0.001 comparisons between days 5 and 8 (D). Abbreviations: A.U., arbitrary unit; GAPDH, glyceraldehyde 3‐phosphate dehydrogenase.
