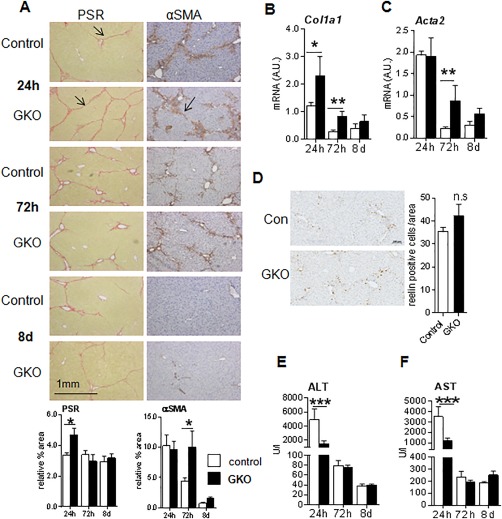
Figure 4.

Increased fibrotic response in livers of GKO mice after CCl4 administration. GKO (black bars) and wild‐type (white bars) mice were administered twice weekly intraperitoneal injections of CCl4 for 12 weeks. The 24‐hour time point represents the peak injury, and 72 hours to 8 days is the scar resolution phase. (A) Representative images of total collagen (PSR), and αSMA staining during injury (24 hours) and resolution (72 hours and 8 days) phases, with arrowheads pointing to intense collagen staining and αSMA‐positive cells in control and GKO mice. Quantification of staining by PSR and αSMA is shown below the corresponding panel of representative images. Pixels of 30‐40 continuous fields (×80) from each section were randomly selected and measured. Hepatic levels of Col1a1 (B) and Acta2 mRNA (C) were measured by quantitative PCR and normalized for 18S. (D) Representative images (scale bar, 100 μm) and quantification graph of reelin immunohistochemistry (at 72 hours) to identify HSCs. Plasma levels of ALT (E) and AST (F) during injury and resolution phases. n = 5‐6 in each group; * P < 0.05, ** P < 0.01, *** P < 0.001 between genotypes within time points. Abbreviation: A.U., arbitrary unit.
