Figure 5.

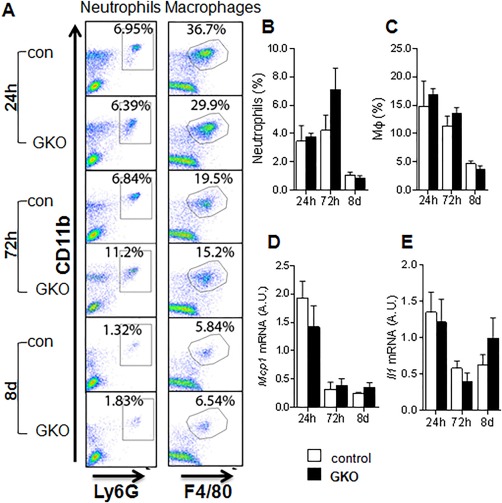
Similar inflammatory responses to control mice in GKO following CCl4 liver injury. (A) A panel of representative flow‐cytometric images gating for Ly6G+CD11b+ cells (neutrophils) and F4/80+CD11b+ cells (macrophages) with quantification graphs for inflammatory cells as percentage of neutrophils (B) and macrophages (C) among all nonparenchymal cells in the liver. Hepatic levels of mRNAs encoding monocyte chemoattractant protein‐1 (D) and interleukin‐1beta (E) quantified by quantitative PCR and normalized for 18S in control (white bars) and GKO (black bars) mice. There were no differences between groups (n = 6/group). Abbreviations: A.U., arbitrary unit; Il1, interleukin 1; Mcp1, monocyte chemoattractant protein‐1.
