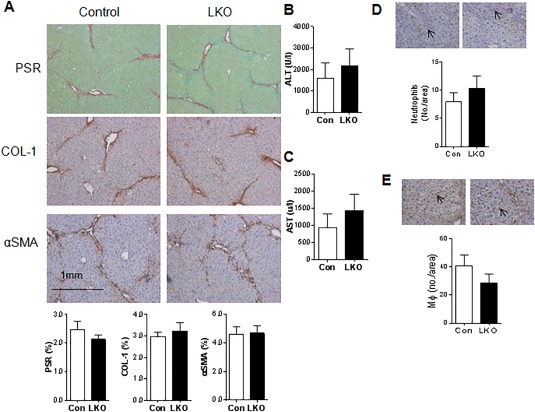
Figure 6.

Mice with hepatocyte‐specific 11βHSD1 deficiency (LKO) and their littermate controls show similar hepatic responses to CCl4 injury. (A) Representative images of total collagen (PSR), Col1, and αSMA staining at 24 hours peak injury in control and LKO mice with quantification graphs at the bottom of each representative image panel. Plasma levels of ALT (B) and AST (C) in control (Hsd11b1 fl/fl; white bars) and LKO (black bars) mice during injury. There were no differences between groups (n = 6/group). Control (white bars) and LKO (black bars) liver sections were stained for neutrophils GR‐1 (Ly6G; D) and macrophages (F4/80; E). For each section 20‐30 consecutive fields with magnification ×400 were quantified. Cells in each field were counted by an investigator, who was blinded for the genotype and treatment of the section. The average cell number per field was calculated. There were no differences between groups (n = 5‐6/group).
