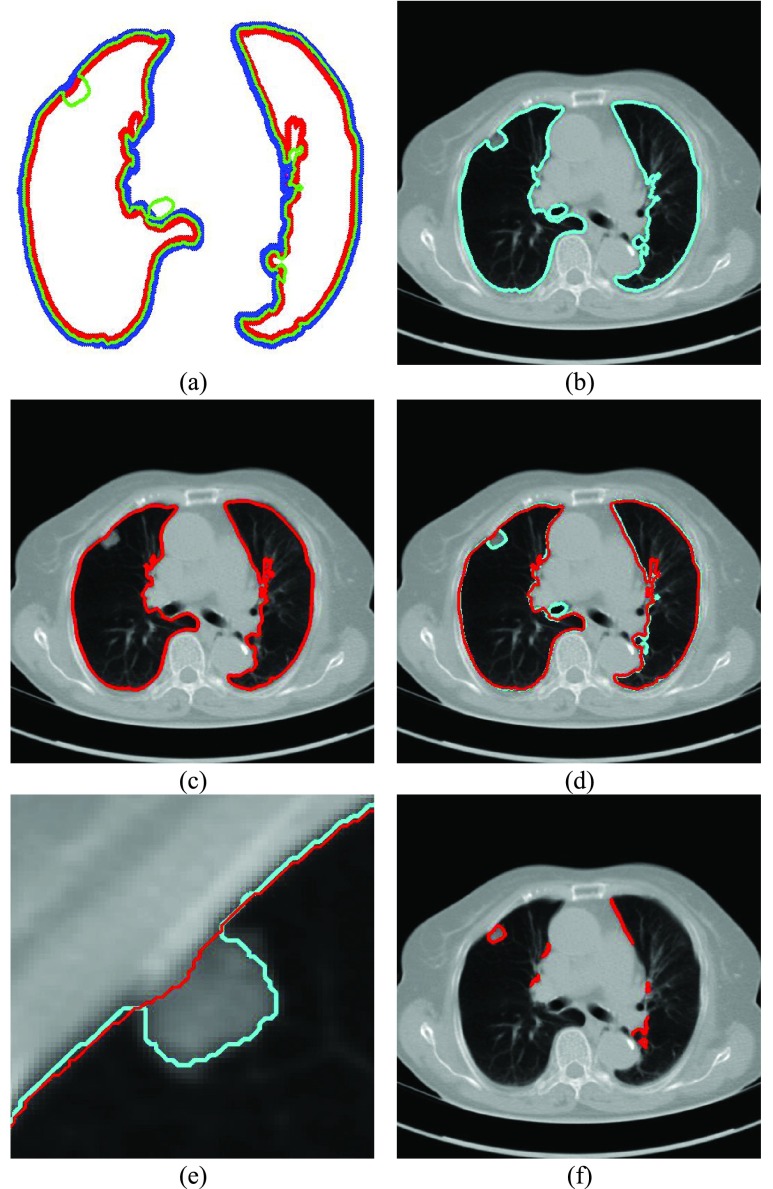
FIGURE 2.
(a) Curve samples by  for dilation (blue) and contraction (red) from
  (b) global contour
  (c) contour sample
  providing the highest correlation value between
  and each curve from
  , (d) the overlapped contours of
  and
and  , (e) enlarged and highlighted juxta-pleural nodule area, and (f) the resultant juxta-pleural nodule candidates.

