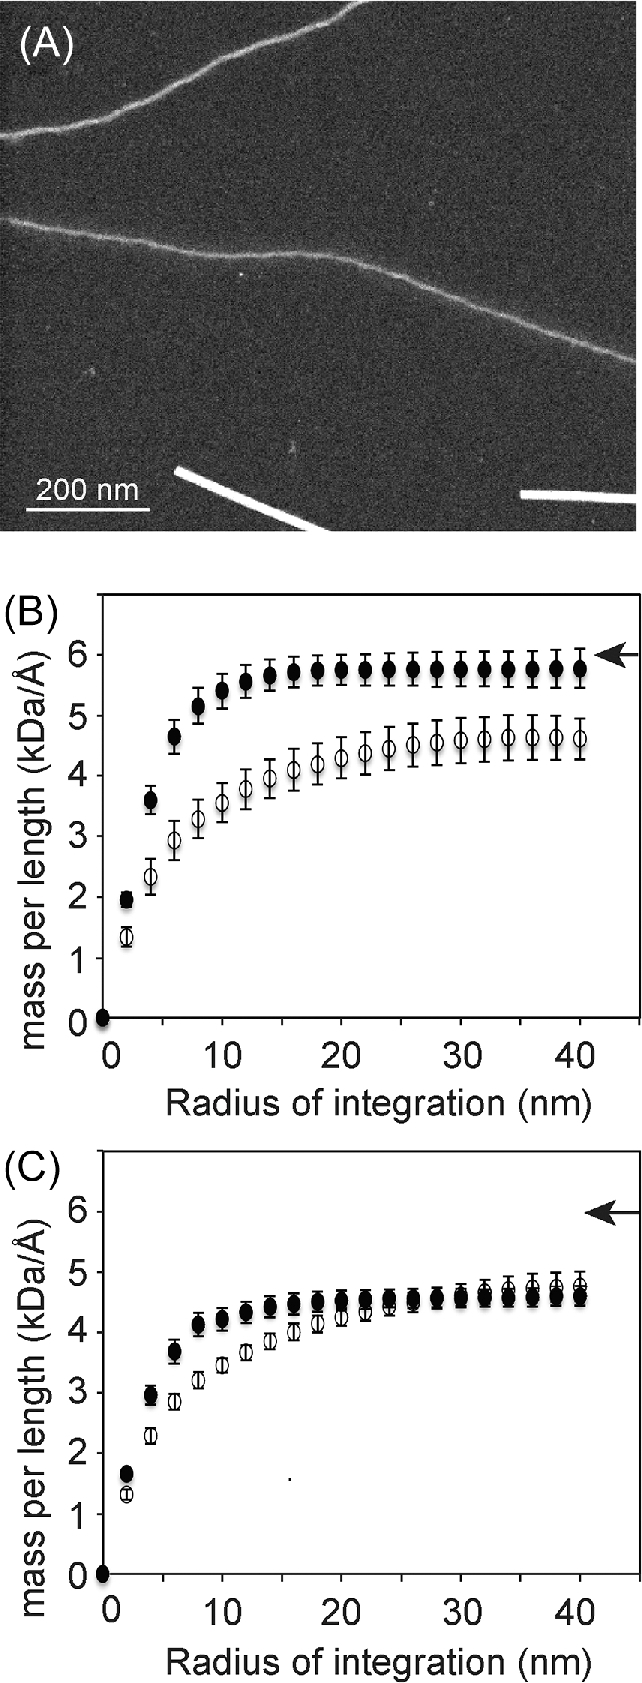
Figure 2.

(A) Dark field STEM image of unstained NM fibrils contained mixtures of thick NM fibrils (top) and thin NM fibrils (middle). TMV is shown as a standard (bottom), which is saturated in this image due to contrast adjustments to enable visualization of thin filaments. Plots of the mpl versus the radius of integration for (B) thick (closed circles) and thin (open circles) forms of strong NM fibrils and (C) thick (closed circles) and thin (open circles) forms of weak NM fibrils. Arrowheads indicate the mpl value that corresponds to one NM monomer (28.5 kDa) per axial cross beta distance (0.47 nm).
