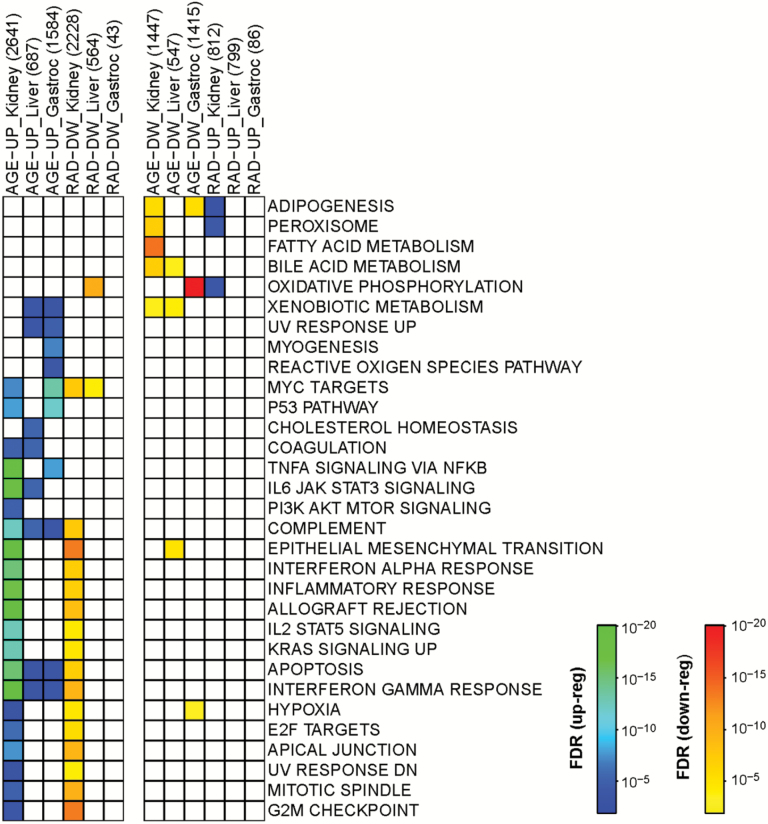
Figure 2.
Functional annotation of gene pathways differentially regulated by age (6-months vs 24-months vehicle-treated groups) and by RAD001 (24-month vehicle vs 24-month RAD001-treated groups) in kidney, liver, and gastrocnemius (gastroc) muscle of rats. Boxes with a color transition from green to blue represent up-regulated pathways (AGE-UP or RAD-UP) with p < 10–20 (green) – p < 10–3 (blue). Boxes with a color transition from red to yellow represent down-regulated pathways (AGE-DW or RAD-DW) with p < 10–20 (red) – p < 10–3 (yellow). Numbers of genes that are regulated in either direction by age or RAD001 are indicated in brackets: eg, AGE-UP_Kidney (2641).

