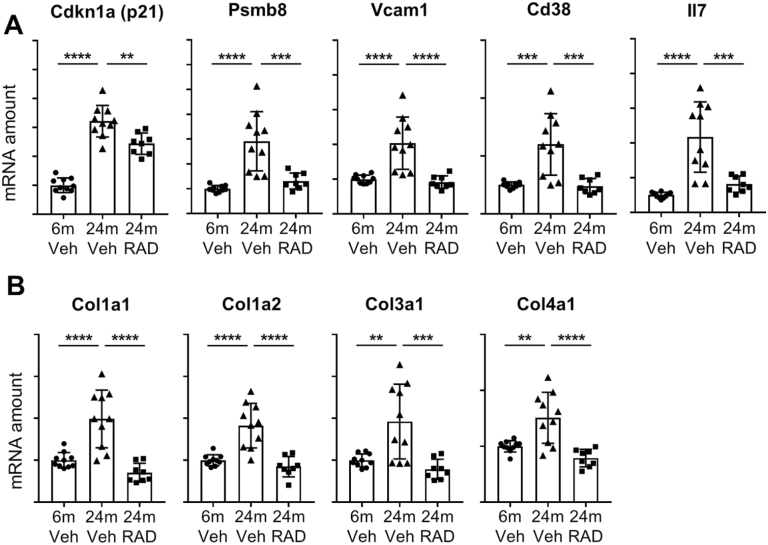
Figure 3.
Validation of interferon gamma (A) and (B) epithelial to mesenchymal transition pathways in the rat kidney. mRNA amounts of the selected genes were quantified by real-time quantitative polymerase chain reaction in the kidneys from 6-month-old rats treated with vehicle and 24-month-old rats treated with vehicle or RAD001. mRNA amounts of the genes of interest were normalized to a geometric mean of reference genes Cox7a2, Vps26a, and TATA-box-binding protein. Data are mean ± SD. **p ≤ .01; ***p ≤ .001; ****p ≤ .0001. Y-axes represent arbitrary units for normalized mRNA amounts. N = 8–10 rats per group.

