Fig 1.
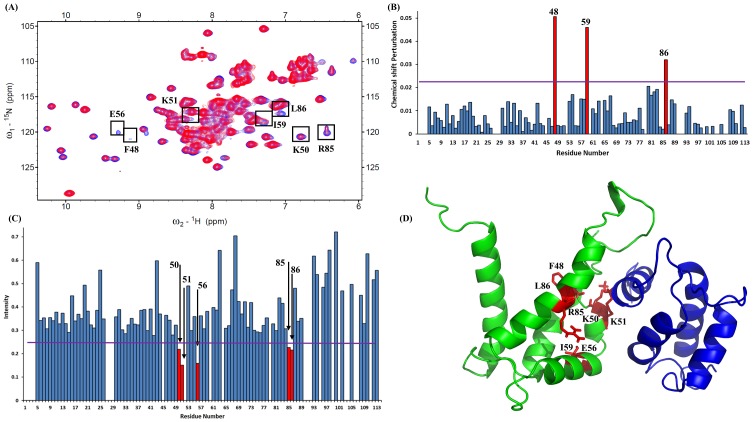
(A). Superimposed HSQC spectra of 1.01 mM S100A9 (15N-labeled) with those of S100A12 at molar ratios of 1:0 (blue) and 1:1 (red). The residues are shown in a black box were recognized using bar diagrams. (B). Bar diagram analysis of chemical shift (1H and 15N) perturbations of the amino acid residues in S100A12 upon complex formation with the S100A9. The threshold of selected residues exhibiting a significant change is represented by a violet line (>0.023). Following equation was used to calculated perturbation, combined shift difference = [(proton shifts)2 + (nitrogen shifts/6.51)2]0.5 (C). Bar diagram analysis of changes in cross-peak intensity ratio (I/I0). I represents the intensity of the S100A9–S100A12 complex, and I0 is the intensity of free S100A12. The violet line shows the threshold of selected residues that display a notably reduced intensity (<0.26). (D). Selected residues of S100A9 labeled in red on the three-dimensional structure of the heterodimer complex of S100A9 (green) and S100A12 (blue).

