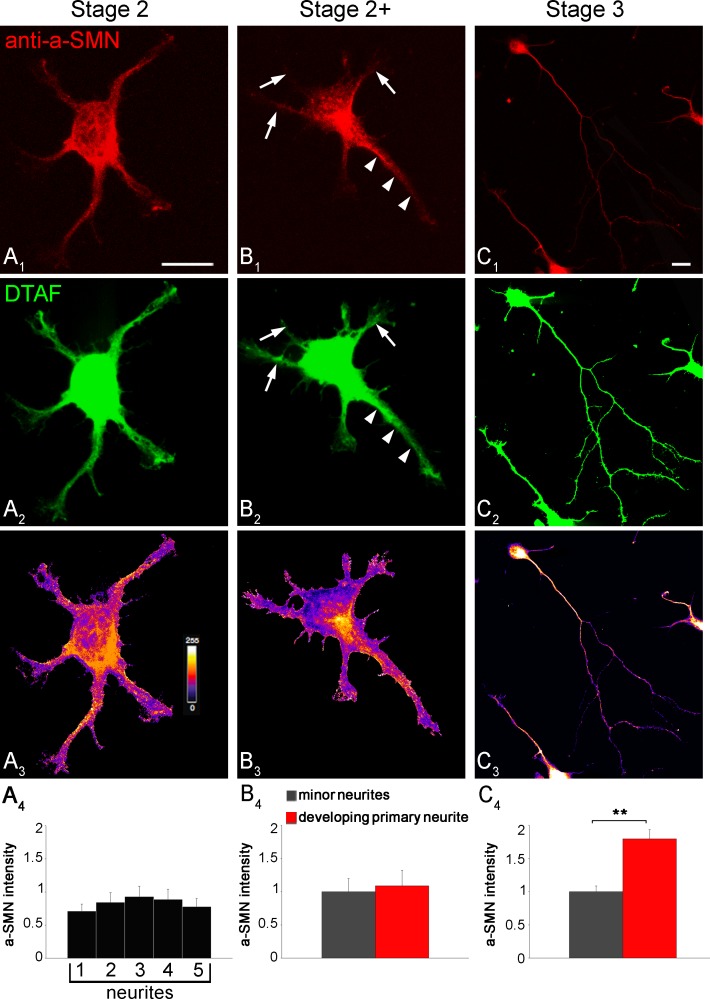
Fig 3. Quantification of a-SMN neuritic labeling during early neuronal differentiation.
Stage 2–3 rat primary hippocampal neurons were co-labeled with the rat-specific anti-a-SMN antibody #553 (A1-C1, red) and the pan-cellular marker 5-DTAF (A2-C2, green). (A3-C3) Pseudocolor images showing heat maps of fluorescence intensity ratio between a-SMN and DTAF, with warm colors denoting higher signal (0–255). (A4-C4) Intensity quantification expressed as a-SMN/DTAF fluorescence ratio. The a-SMN/DTAF ratio was similar in primary neurites at stage 2 (A1-A4) and in primary (arrowheads) vs. minor neurites (arrows) at stage 2+ (B1-B4). By contrast, a-SMN staining was significantly more intense in axons vs. dendrites at stage 3 (C1-C4: axons 1.79 ± 0.14 and dendrites 1.00 ± 0.09). Data are presented as mean ± SEM of 30 random sampled cells for every stage (2, 2+ and 3) from three different experiments. Statistical analysis was performed by Student’s t-test (** p<0.01). Scale bars: 10 μm.

