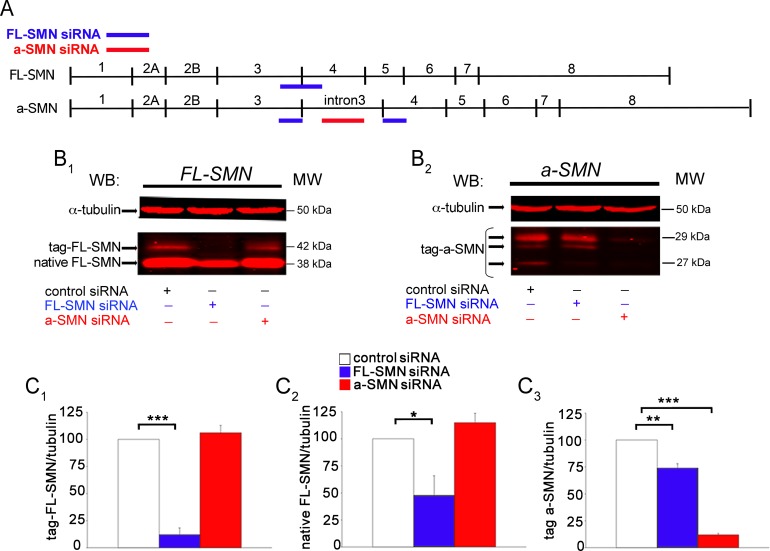
Fig 4. Quantification of FL-SMN and a-SMN silencing in NSC34 motor neurons.
(A) Schematic representation of the binding sites of FL-SMN (blue lines) and a-SMN (red line) specific siRNAs along each respective mRNA sequence. Note that the FL-SMN siRNA against the exon 3/exon 4 junction can make a partial annealing to the end of exon 3 and beginning of exon 4 sequence on the a-SMN mRNA (lower blue lines). (B) Western blot analysis of siRNA silencing in NSC34 cells performed with BD Bioscience anti-SMN antibody against the N-terminal region. (B1) NSC34 motor neurons were co-transfected with rat FL-SMN tagged construct and control or FL-SMN or a-SMN siRNAs as indicated at the bottom of the blot. Labels on the left indicate the native FL-SMN and the transfected tagged protein as a slightly higher band. Tubulin was reported as loading marker (upper red band). Molecular weights are reported on the right (MW). (B2) NSC34 motor neurons were co-transfected with rat a-SMN tagged construct and control or FL-SMN or a-SMN siRNAs as indicated at the bottom of the blot. Transfection of NSC34 with tag-a-SMN led to the expression of three SMN bands, as indicated in the label on the left. Molecular weights are reported on the right (MW). (C) Histograms showing the quantification of immunoreactive ratio of FL-SMN or a-SMN/tubulin in all experimental groups. (C1) The 42 KDa tagged-FL-SMN protein expression was significantly down-regulated by FL-SMN siRNA to 12% (***p < 0.001; B1, blue bar) compared to control non-target siRNA (white bar). a-SMN siRNA did not modify FL-SMN protein levels (red bar). (C2) Native FL-SMN was significantly down-regulated by FL-SMN siRNA to 47% (*p < 0.05; blue bar), compared to control (white bar). No significant difference was obtained with a-SMN siRNA (red bar) vs. control (white bar). (C3) The expression of all the transfected tag-a-SMN proteins were down-regulated by a-SMN specific a-SMN siRNA to 12% (***p < 0.001; C1, red bar), compared to control non-target siRNA (white bar). Note that the exogenous a-SMN was significantly reduced also by the FL-SMN siRNA (to 74%, **p < 0.01; C1, blue bar) probably due to the partial annealing of the FL-SMN siRNA to the exon 3 and 4 sequence of the a-SMN mRNA. Data were normalized versus α-tubulin protein levels and were presented as mean ± SEM of three different experiments. Statistical analysis was performed by Student’s t-test.

