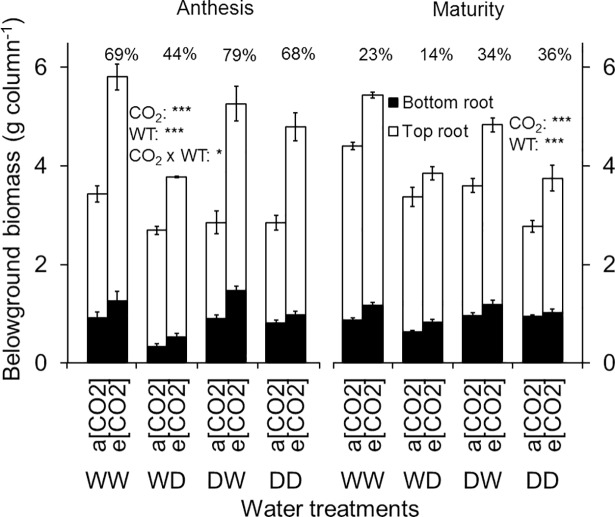
Fig 5. Belowground biomass production of wheat cv. Yitpi at growth stages anthesis and maturity.
Belowground biomass is the sum of top and bottom roots. Top and bottom root refer to the dry weight of roots in the top and bottom layers, respectively of the split-columns. Bars represent mean values and error bars indicate standard errors of 3 and 4 replicate columns (3 plants in each) at anthesis and maturity, respectively. At both stages, main effect CO2 and WT were significant for top and bottom roots. Percent change in belowground biomass due to e[CO2] is shown at the top of each bar for the respective WT. Asterisks indicate significance of the effects of CO2 and water treatments (WT) as well as their interaction. Significance levels are indicated by the P value: *, P < 0.05; **, P < 0.01; ***, P < 0.001.

