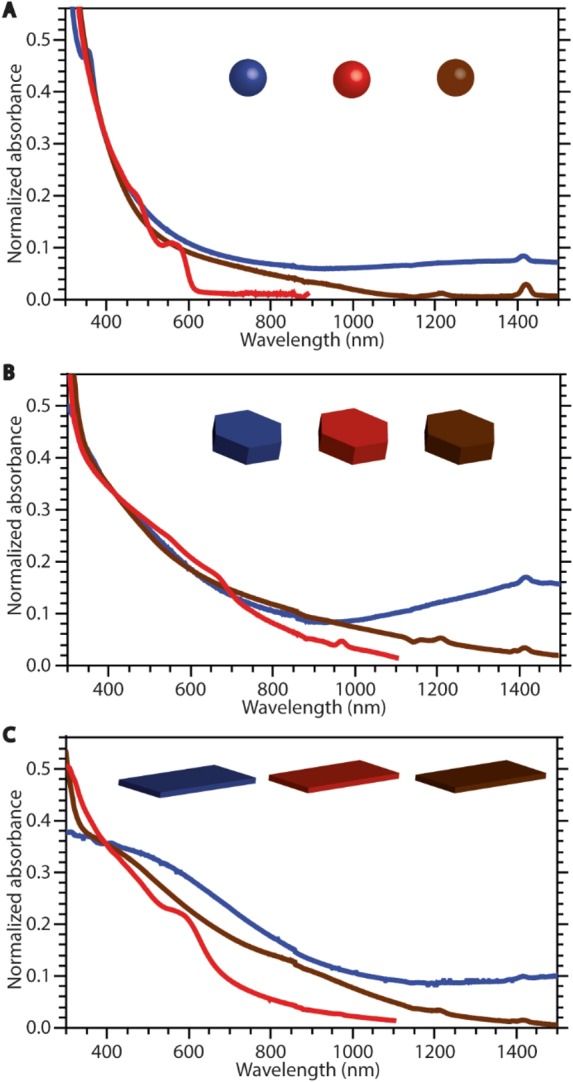
Figure 3.

Absorption spectra of template Cu2–xSe NCs (blue lines) and product CdSe NCs (red lines) and CuInSe2 NCs (brown lines) obtained after CE reactions (Cu+ for Cd2+, and partial, self-limited Cu+ for In3+, respectively). The spectra were normalized at 400 nm. TEM images of the samples used to acquire the optical spectra are shown below (Figure 4). (A) Absorption spectra of quantum dots of different compositions. (B) Absorption spectra of thick nanoplatelets. Optical spectra of thinner (l ≤ 4.2 nm) CdSe nanoplatelets displaying PL are shown in Figure S11. (C) Absorption spectra of ultrathin nanosheets.
