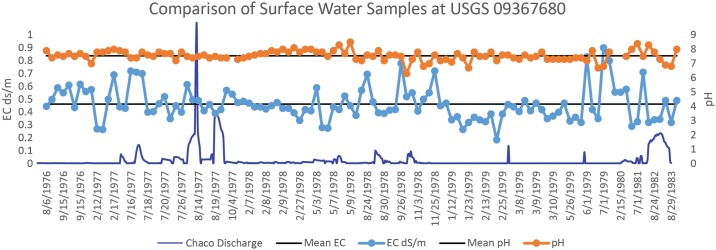
Fig 2. Shows the relation of key water characteristics for 113 observations between 8/6/1976 and 10/6/1983.
The average for pH (7.55) and EC (0.46) are each indicated by a solid line behind each data type. Chaco discharge is shown for visual comparison of covariation between periods of increased flow and EC.

