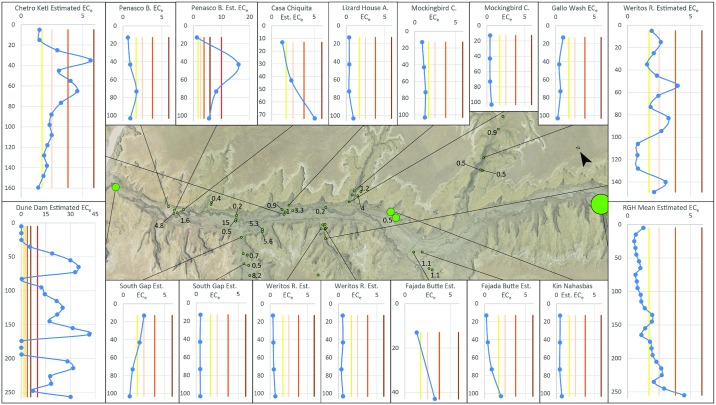
Fig 4. Figure shows the location for all known soil salinity samples in the main are of Chaco Canyon.
Larger circles are to avoid providing precise location information for non-public archaeological areas. Selected profiles are presented with values for single depth samples shown next to their location. Blue circles, connected by a simple smoothed line for visual interpretation, represent estimated ECe values in profiles. For sources that specify a depth range for specific samples, point depth is the range midpoint. For each salinity graph, the Y-Axis is Depth (cm), and the X-Axis is Estimated ECe. Vertical lines represent varying yield decrease thresholds for maize (moving left to right): Yellow = 0%, Peach = 10%, Orange = 25%, Brown = 50%, and (when shown) Red = 100%. See S1 Table for raw and converted data.

