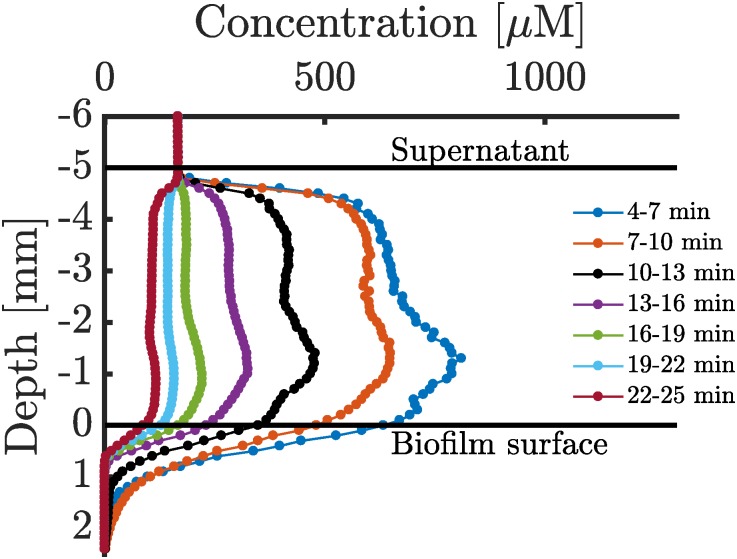
Fig 1. Oxygen profiles sampled after 90 minutes of HBOT.
Oxygen profiles are recorded after 90 minutes of HBOT applied to a 5 mm thick agarose biofilm, hence an unloading process of an already oxygen penetrated biofilm is observed. Oxygen profiling was initiated 4 minutes after the 90 minutes HBOT and every profile takes approximately 3 minutes to record. Horizontal black bars represent supernatant and biofilm surfaces, respectively. The concentration of oxygen in the supernatant immediately after treatment is approximately 1000 μM as the chamber has to be decompressed to 1 atm. The biofilm is present for depth 0 mm to 5 mm while the supernatant is present in the region from −5 mm to 0 mm. The supernatant is displayed primarily to verify that the mixing is strong in this region. Figure modified from [3].

