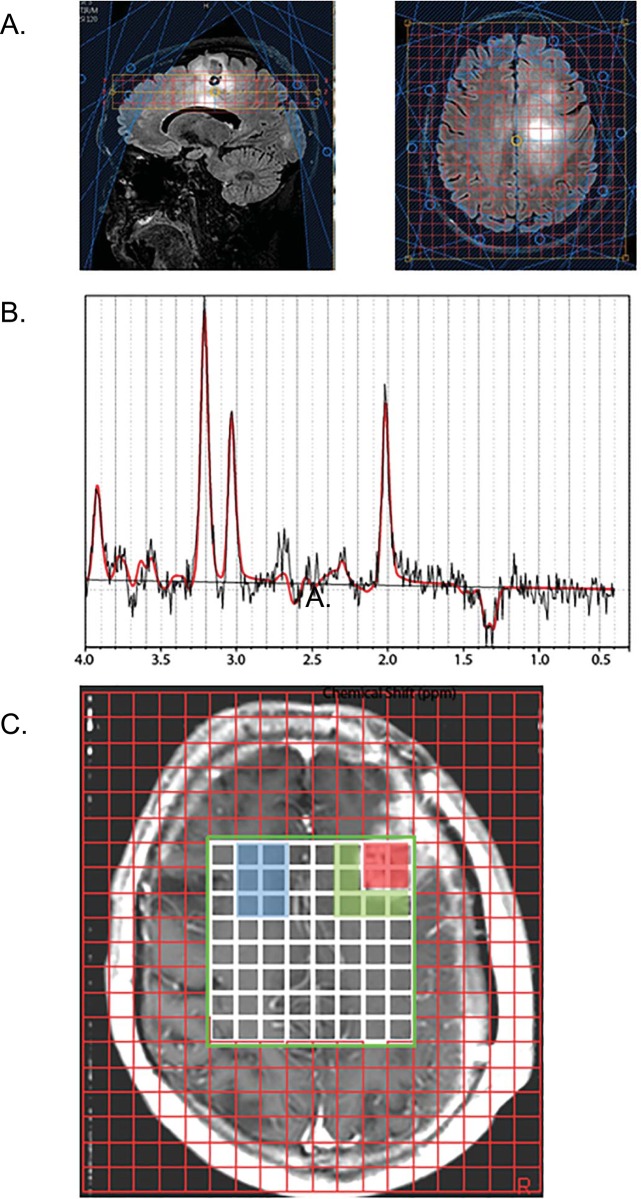
Fig 2. MRSI methods.
A: Sagittal (left) and axial (right) MRSI voxel placement on a Philips scanner. Three slices were acquired with 2D phase encoding of 12x11. Data were acquired using a point-resolved spectroscopy excitation pulse sequence for signal localization. Acquisition parameters for all MRSI data included TE = 135–144 ms and TR = 1140–1180 ms. Also shown are the saturation bands for lipid suppression. B: The spectroscopic raw data were analyzed using LCModel 6.1 Software to determine the quantities of the metabolites NAA at 2 ppm, Cr at 3 ppm, Cho at 3.2 ppm, and Lac, a doublet, at 1.3 ppm. The gray line shows the spectrum; the red line indicates the fit of the MRS data. C: For spectra classification, MRSI data were overlaid on the post-contrast T1-weighted images. Voxels were classified into (i) enhancing tumor (red), (ii) non-enhancing peritumoral parenchyma approximately 1–1.5cm beyond the enhancing margin (green), and (iii) contralateral normal white matter (blue).

