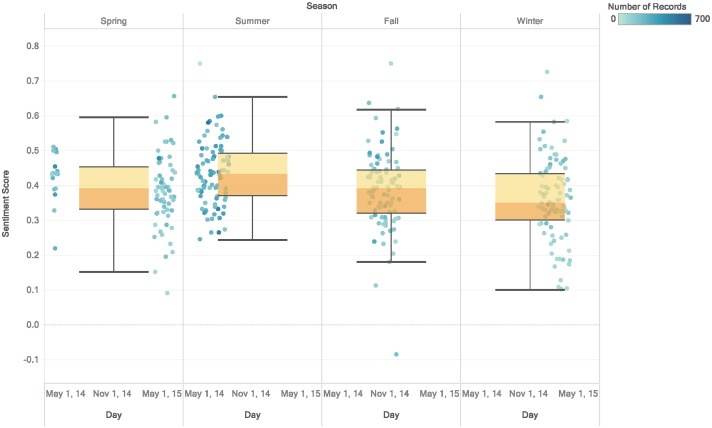
Fig 5. Sentiment scores per season.
Daily average sentiment scores split across four seasons from Spring to Winter. The data distribution in each season is summarized using a Box and Whisker plot. Summer receives the highest positive sentiment with many data points rising above a 0.4 score. Spring and Fall follow with similar sentiment scores concentrated below 0.4 scores. Winter, on the other hand, appears to have the lowest sentiment scores with a concentration falling below 0.35.

