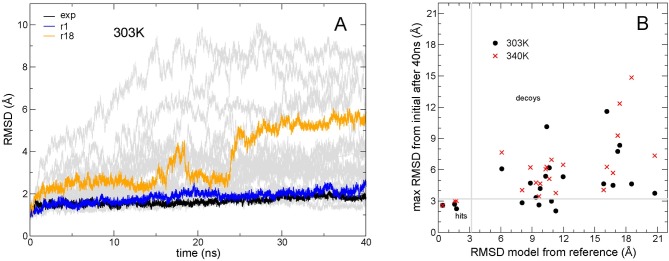
Fig 5. Comparison of simulations from different models of complex Efb-C:C3d.
(A) RMSD (Cα) from the respective initial structure for the highest ranking RosettaDock models of complex Efb-C:C3d as a function of simulation time; simulations were performed at 303 K; highlighted in black is the simulation starting from the experimental structure, and in blue and orange from two selected models (also shown in Fig 6); in grey are shown all simulations starting from the 20 highest scoring models. (B) RMSD after 40 ns simulation plotted versus the RMSD deviation of the model from the crystal structure; simulations started from the RosettaDock models at two different temperatures; at the higher temperature (300 and 340K).

