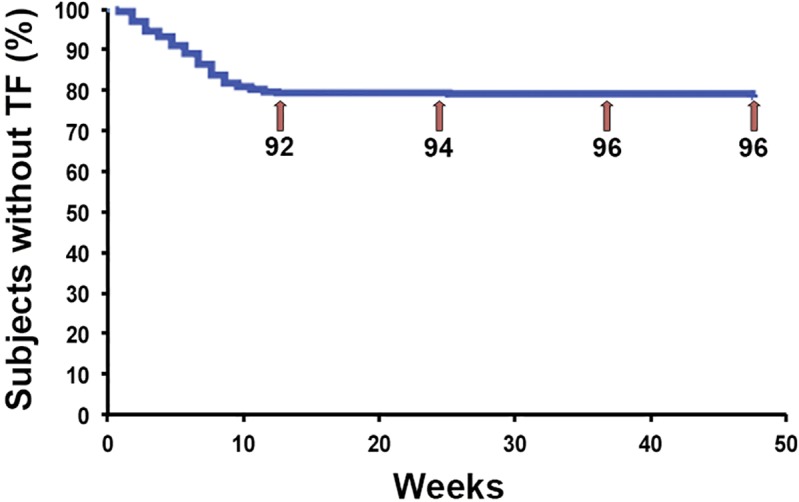
Fig 2. Ad hoc Kaplan-Meier curve.

Numbers represent the cumulative number of patients at risk of treatment failure at 12, 24, 36 and 48 weeks.

Numbers represent the cumulative number of patients at risk of treatment failure at 12, 24, 36 and 48 weeks.