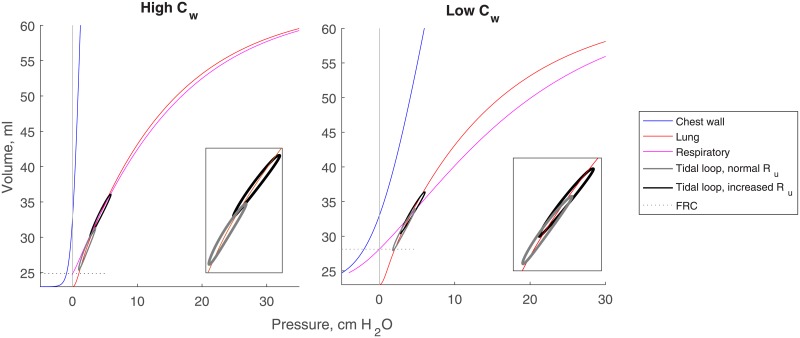
Fig 2. Lung, chest wall, and total respiratory system compliance curves for high Cw (left) and low Cw (right).
Curves are described by Eqs (9) and (10) and parameterized using the procedures described in Parameterization. Tidal breathing loops with normal Ru (grey) and increased Ru (black) are superimposed for each condition over the lung compliance curve and larger in each inset to display hysteresis.

