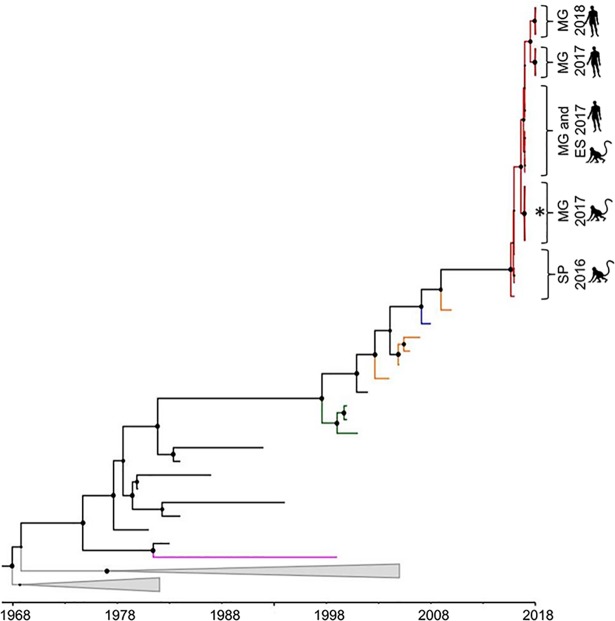
Fig 1. Bayesian phylogenetic analyses of Yellow fever virus.
The maximum clade credibility tree inferred using 60 Yellow fever virus sequences (1,038 nt) from South America is shown. The posterior probability values are represented by circles drawn in scale in the nodes. Clades containing Brazilian Yellow fever virus from outbreaks 2000–01, 2008–09 and the current (2016–2018) are shown in green, blue and red, respectively. Terminal branches in orange, pink and black represent sequences of Yellow fever virus from Venezuela, Bolivia, and Brazil, respectively. South African genotypes are collapsed in grey. Horizontal branch lengths are drawn to a scale of years. The tree was reconstructed using the nucleotide substitution model HKY with gamma distribution (four categories), under the relaxed molecular clock and Bayesian skyline demographic model. ES: Espírito Santo state, MG: Minas Gerais state and SP: São Paulo state. The asterisk (*) denotes the cluster of Yellow fever virus obtained from non-human primates which had two amino acid substitutions characterized as synapomorphies. Analyses were performed using programs from BEAST package v.1.8.4 [21], BEAUTi v.1.8.2 [21], Tracer v.1.5.0 [23], TreeAnotator v.1.8.2 [24] and FigTree v.1.4.3 [26].

