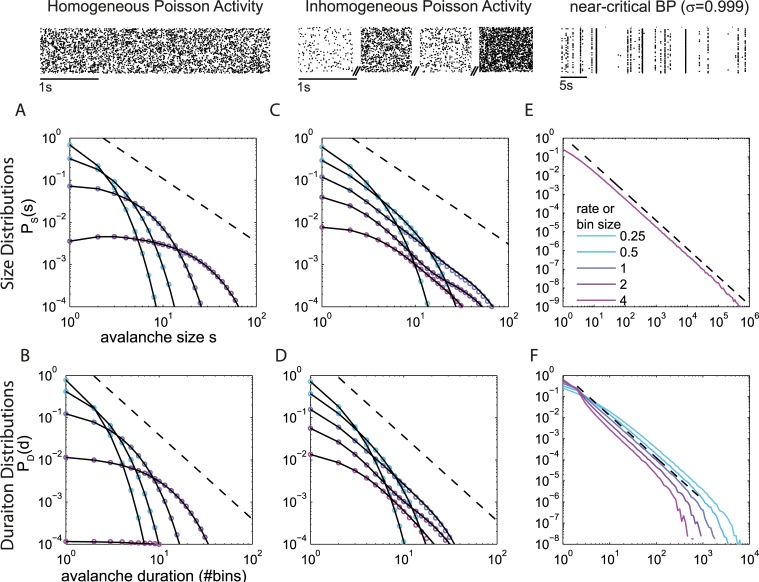
Fig 2.
(Color) Avalanche size and duration distributions for three example processes, as exemplified in the raster plots above, all with the same mean rate: A&B. homogeneous Poisson process, C&D. inhomogeneous Poisson process, E&F. critical branching process (BP). Different colors represent different bin sizes, Δt, at r = 1 (or equivalently different rates r at Δt = 1). Colored lines or dots are numerical results; black lines are analytical results. A-D. For both the homogeneous and the inhomogeneous Poisson processes, an increase in Δt (or r) makes the size distribution PS(s) and the duration distribution PD(d) flatter. E&F. For the critical system, a change in Δt (or r) hardly changes PS(s), which shows a power law with exponent -1.5 (dashed). The slope of PD(d) changes systematically, because d is in units of bins. In units of time steps, PD(d) would also change very little and show the exponent -2 (dashed).

