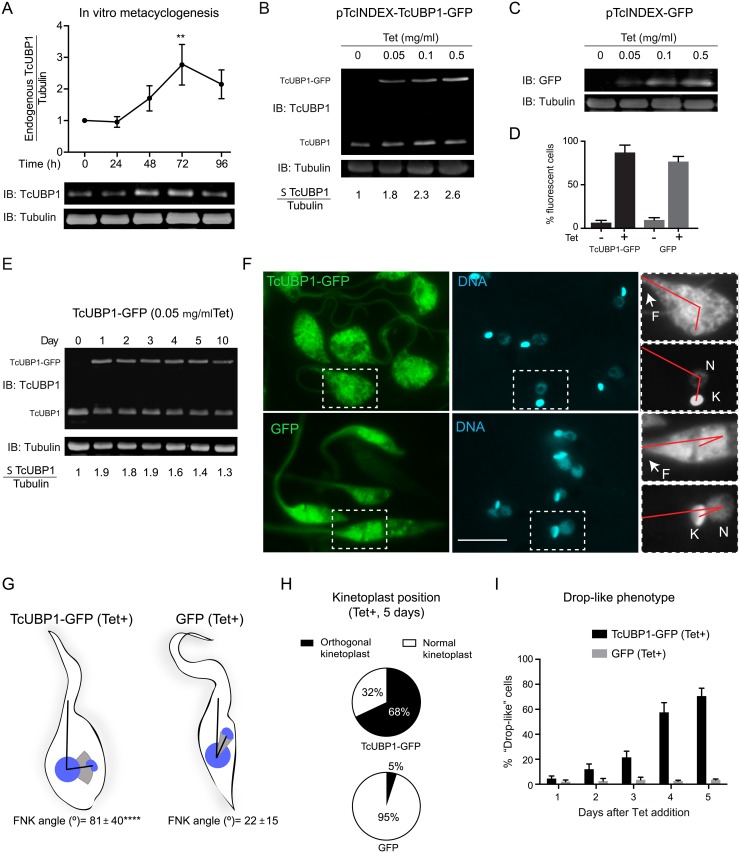
Fig 1. TcUBP1-GFP ectopic expression in epimastigotes.
(A) Wt epimastigotes were incubated in TAU-3AAG medium and TcUBP1 expression was assessed by Western blot for four days. Tubulin blot served as loading control. Values represent mean ± SD of 3 independent replicates. TcUBP1/Tubulin before TAU incubation was considered as 1. A representative Western blot experiment is shown. **P< 0.01 by Anova-Dunnett test. (B) Levels of TcUBP1-GFP induced expression 48 hours after the addition of different concentrations of Tet determined by Immunoblot (IB), and compared to TcUBP1 endogenous levels using an anti-TcUBP1 antibody. The ratio between the sum (Σ) of TcUBP1 forms (endogenous and ectopic) and Tubulin before Tet addition was considered as 1. (C) Levels of GFP induced expression at different Tet concentrations detected with an anti-GFP antibody and compared to Tubulin levels. (D) Percentage of GFP positive epimastigotes before and after induction with Tet determined by flow cytometry. Values represent mean ± SD of 6 independent replicates. (E) Immunoblot from a time course analysis of TcUBP1-GFP induced expression using 0.05 μg/ml Tet, together with endogenous TcUBP1. Tubulin was used as a loading control. The ratio between the sum of TcUBP1 forms (endogenous and ectopic) and Tubulin before Tet addition was considered as 1. (F) Fluorescence microscopy of epimastigotes expressing TcUBP1-GFP, or GFP, after 5 days of induction. Magnifications highlight a red line connecting the base of the flagellum, the nucleus and the kinetoplast, evidencing the repositioning of the kinetoplast. DNA was stained with DAPI, shown in cyan. Images are representative of 6 independent experiments. Scale bars, 5 μm. (G) Parasites schemes represent approximate forms obtained from induced TcUBP1-GFP or GFP cultures. In these parasites, the angle formed by the flagellum, the nucleus and the kinetoplast (FNK angle) was measured. The mean FNK angle is shown with black lines, and the kinetoplast is placed in this mean position. The gray spectrum represents SD above and below the mean FNK angle. ****P<0.0001 by T test (TcUBP1 N = 64, GFP N = 58). (H) Pie chart representing the mean percentages of cells with orthogonal or normal kinetoplast position in parasites induced for the expression of TcUBP1-GFP or GFP after 5 days. Values were obtained from 4 independent experiments. (I) Time course quantitation of parasites displaying drop-like phenotype in induced TcUBP1-GFP and GFP cultures.

