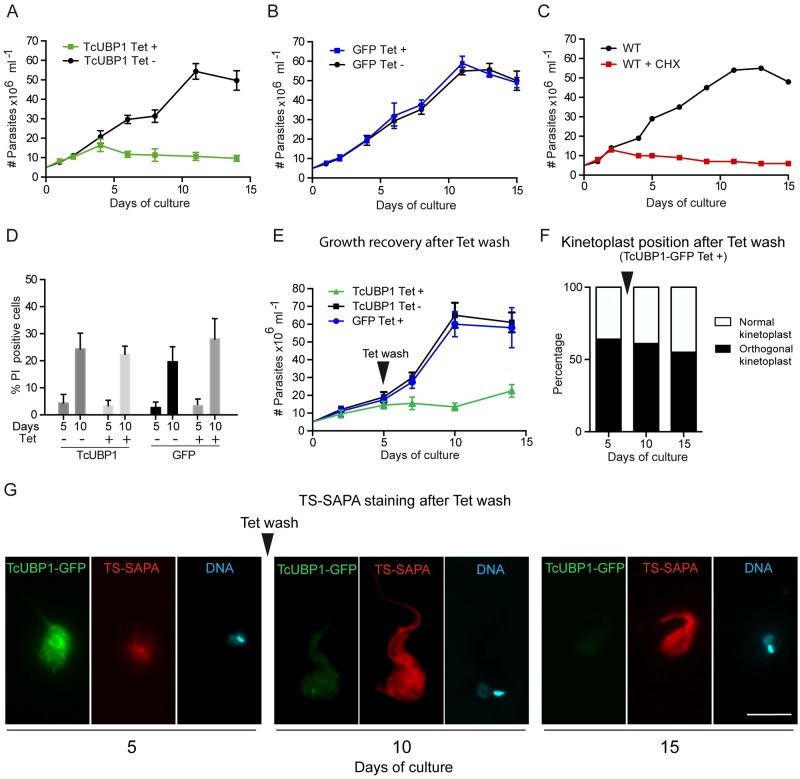
Fig 6. Irreversible growth arrest in parasites ectopically expressing TcUBP1.
(A and B) Growth curves of induced and non-induced epimastigotes expressing TcUBP1-GFP or GFP. Values represent mean ± SD of 5 independent replicates. (C) Growth curves of wt epimastigotes in the presence or absence of CHX. Values represent mean ± SD of 3 independent replicates. (D) The percentage of dead cells was determined by flow cytometry by incubating parasites with propidium iodide at 5 and 10 days after Tet addition. Values represent mean ± SD of 4 independent replicates. (E) Growth curves of induced and non-induced epimastigotes expressing TcUBP1-GFP or GFP. At day 5 of culture, Tet was removed by washing and fresh medium was added. Values represent mean ± SD of 4 independent replicates. (F) Kinetoplast repositioning was evaluated by microscopy. Cells were stained with DAPI. (G) Staining of TS-SAPA by immunofluorescence in induced early-log epimastigotes expressing TcUBP1-GFP, and after Tet wash. DNA was stained with DAPI, shown in cyan. Images are representative of 3 independent experiments.

