Figure 1.
Phenotypic Comparison and Pi Contents among Various Genotypes.
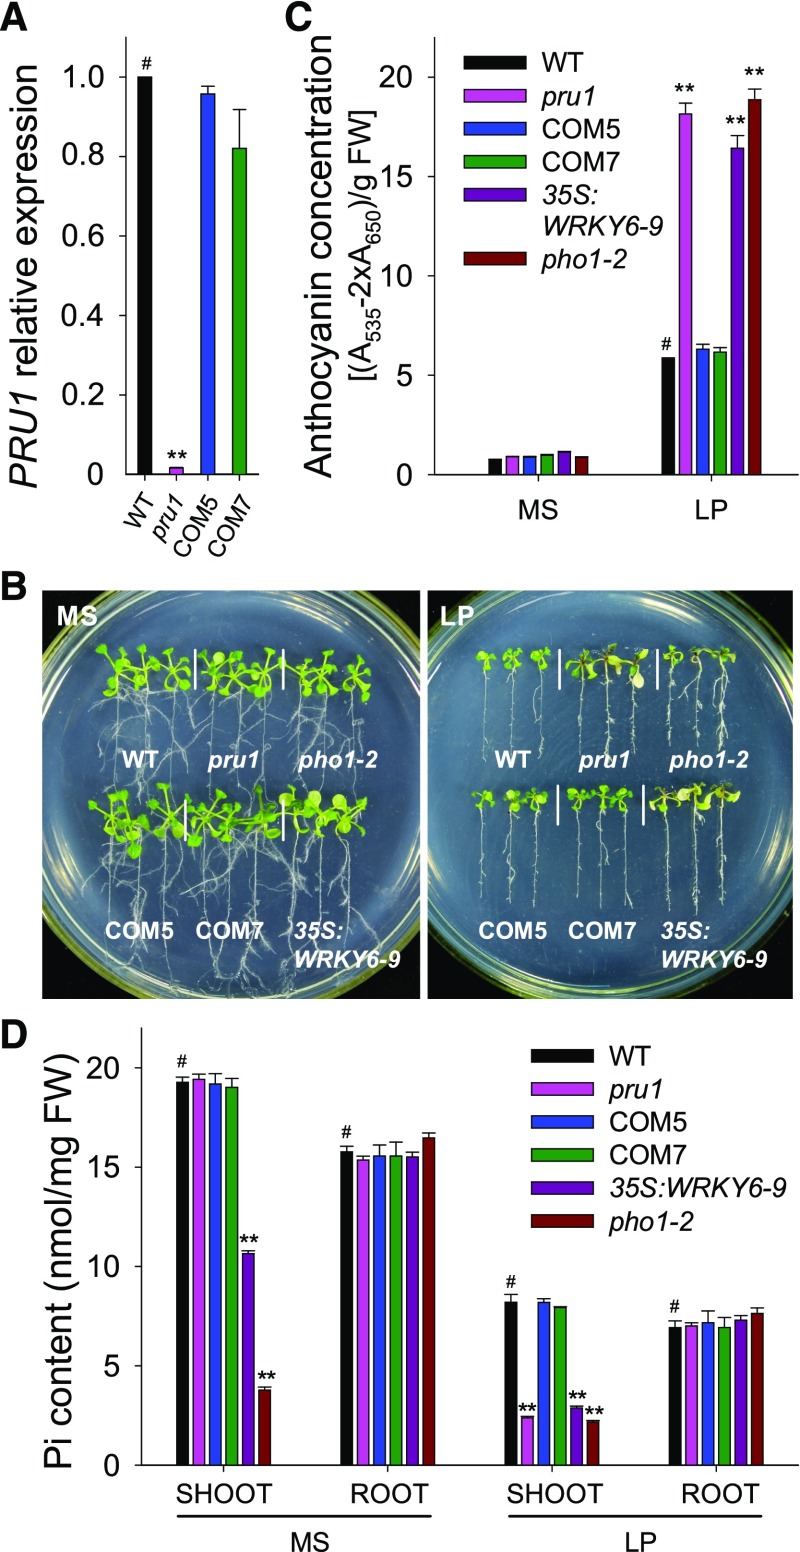
(A) Analysis of PRU1 expression in the pru1 mutant, complementation lines (COM5 and COM7), and wild-type plants (WT) using RT-qPCR. Data are the mean values of three biological replicates ± se.
(B) Phenotypic comparison. All genotypes were germinated and grown on MS medium for 7 d and then transferred to either MS medium or LP medium (LP, low-Pi medium containing 10 μM Pi) for another 7 d.
(C) Anthocyanin measurement. The 7-d-old seedlings were transferred to MS or LP medium for 7 d and then harvested for anthocyanin content measurements. The experiments were performed in biological triplicate, and 15 plants were measured in each replicate. FW, fresh weight.
(D) Pi content measurement. The 7-d-old seedlings were transferred to MS or LP medium for 5 d, the shoots and roots were harvested, and Pi content was measured. The experiments were conducted in biological triplicate, and a group of 15 seedlings was used as one biological sample.
Asterisks indicate significant differences compared with wild-type plants (#) by Student’s t test: **P < 0.01.

