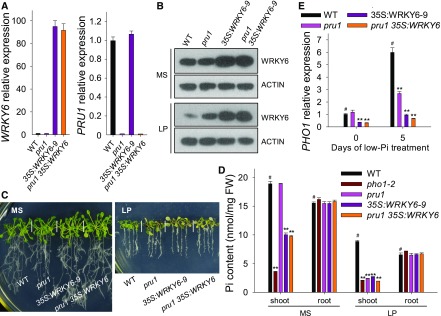
Figure 8.
The pru1 35S:WRKY6 Line Shows a Similar Phenotype to the 35S:WRKY6-9 Line.
(A) Analysis of transcript abundance of WRKY6 and PRU1 in the pru1 mutant, WRKY6-overexpressing line (35S:WRKY6-9), pru1 35S:WRKY6 line, and wild-type plants by RT-qPCR. Data are mean values of three biological replicates ± se.
(B) Immunoblot analysis of WRKY6 in the pru1 mutant, 35S:WRKY6-9, pru1 35S:WRKY6 line, and wild-type plants. Seven-day-old seedlings were transferred to MS or LP medium for 3 d, and then the roots were harvested and protein was extracted. The abundance of WRKY6 was analyzed using an anti-WRKY6 antibody. ACTIN was used as the loading control.
(C) Phenotypic comparison of various genotypes. Seven-day-old seedlings were transferred to MS or LP media for 7 d, and then photographs were taken.
(D) Pi content measurement. Seven-day-old plants were transferred to MS or LP media for 5 d, and then the shoots and roots were harvested for Pi content measurements. Three biological replicates were performed, and a group of 15 seedlings was pooled for each biological sample. Data are mean values of three biological replicates ± se.
(E) Analysis of PHO1 expression by RT-qPCR. Seven-day-old plants of various genotypes were transferred to LP medium, and the roots were harvested at the indicated time points for RNA extraction. Data are mean values of three biological replicates ± se. Asterisks in (D) and (E) indicate significant differences compared with wild-type plants (#) by Student’s t test: **P < 0.01.

